Select menu: Graphics | Ecology | Species Abundance Plot
Use this to produce rank/abundance, ABC or k-dominance plots.
- After you have imported your data, from the menu select
Graphics | Ecology | Species Abundance Plot. - Fill in the fields as required then click Run.
A rank/abundance plot (or Whittaker plot) can be used to visualize species abundance distributions. In this plot, the number of individuals of each species are sorted in descending order, and the proportion of the total number of individuals for each species is then plotted on the log scale against the species rank. The shape of the rank/abundance plot can provide an indication of dominance or evenness; for example, steep plots signify assemblages with high dominance while shallower slopes indicate higher evenness.
A k-dominance plot displays the cumulative proportion abundance against the log species rank. For this type of plot, more elevated curves represent less diverse assemblages.
An abundance/biomass comparison (or ABC curve) is an adaptation of the k-dominance curve where two measures of abundance are plotted: the number of individuals and biomass data. This plot is useful to explore the level of disturbance affecting assemblage.
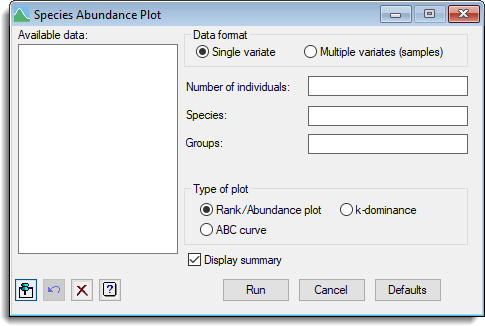
Available data
This lists data structures appropriate to the current input field. The contents will change as you move from one field to the next. You can double-click a name to copy it to the current input field or type the name.
Data format
Specifies the format of the plot data. For the rank/abundance and k-dominance plots you can supply the data in different ways. Select Single variate to supply the individuals in a single variate. Alternatively, select Multiple variates (samples), if you are supplying the data in multiple samples of individuals.
Number of individuals
A variate containing the numbers of individuals per species.
Species
For a rank/abundance or k-dominance plot you can use this to specify a variate containing the number of species for the associated number of individuals in the corresponding element of Number of individuals. You can leave this field empty if each of the values in Number of individuals corresponds to one species.
Biomass
For an ABC curve this species a variate containing the biomass data for each species.
Groups
A factor specifying the groups for different samples.
Samples of individuals
For multiple samples this lets you specify one or more variates containing the individuals for different samples. To move multiple selections from the Available data list hold the Ctrl key on your keyboard as you select items then click ![]() to move them all in one action.
to move them all in one action.
Type of plot
Controls the type of plot that is produced. You can select either Rank/Abundance plot, k-dominance or ABC curve.
Display summary
When selected, displays a summary of the number of individuals and species. If you selected an ABC curve the summary will include the W statistic.
Action Icons
| Pin | Controls whether to keep the dialog open when you click Run. When the pin is down |
|
| Restore | Restore names into edit fields and default settings. | |
| Clear | Clear all fields and list boxes. | |
| Help | Open the Help topic for this dialog. |
See also
- Species Abundance Models menu
- Diversity menu
- ECABUNDANCEPLOT procedure