Select menu: Stats | Distributions | Species Abundance Models
This dialog provides a range of distributions and models that can be used to describe species abundance data. For the Log-series, Poisson-log-Normal and Negative Binomial distributions, the species abundance data are grouped into ‘octaves’ using a logarithmic scale. These distributions are then fitted using the DISTRIBUTION directive using the octave classes. The Geometric series, Zipf and Zipf-Mandelbrot models are fitted to the observed abundance data using the non-linear regression facilities. See the ECFIT procedure for further details about the available distributions and models.
- After you have imported your data, from the menu select
Stats | Distributions | Species Abundance Models. - Fill in the fields as required then click Run.
You can set additional Options before running and store the results by clicking Store.
Available data
This lists data structures appropriate to the current input field. The contents will change as you move from one field to the next. You can double-click a name to copy it to the current input field or type the name.
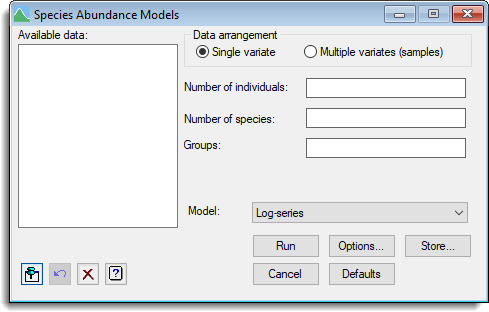
Data arrangement
Specifies the format of the data for the plot. Select Single variate to supply the individuals in a single variate. Alternatively, select Multiple variates (samples) if you are supplying the data in multiple samples of individuals.
Number of individuals
A variate containing the numbers of individuals per species.
Number of species
A variate containing the number of species for the associated number of individuals in the corresponding element of Number of individuals. This field can be left empty if each of the values in Number of individuals corresponds to one species.
Groups
A factor specifying the groups for different samples.
Samples of individuals
For multiple samples this lets you specify one or more variates containing the individuals for different samples. You can transfer multiple selections from Available data by holding the Ctrl key on your keyboard while selecting items, then click ![]() to move them all across in one action.
to move them all across in one action.
Model
Controls the distribution or model that is to be fitted to the data. You can choose from Log-series, Poisson-log-Normal, Negative binomial, Zipf, Zipf-Mandelbrot and Geometric series. See the ECFIT procedure for further details about the available distributions and models.
Action Icons
| Pin | Controls whether to keep the dialog open when you click Run. When the pin is down |
|
| Restore | Restore names into edit fields and default settings. | |
| Clear | Clear all fields and list boxes. | |
| Help | Open the Help topic for this dialog. |