Use this to set options for fitting distributions or models to species abundance data.
Display
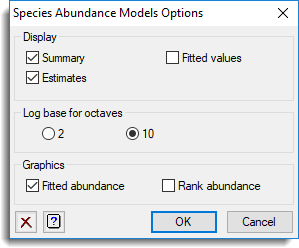
Specifies the output to be displayed.
| Summary | Summary of the analysis. |
| Estimates | Displays estimates of the parameters. |
| Fitted values | Displays the fitted values. |
Log base for octaves
Controls the log base used for forming the octaves for the log series, Poisson log-normal and negative binomial distributions. You can choose between base 2 (representing doubling in species abundance) or base 10.
Graphics
Specifies the plots to be displayed.
| Fitted abundance | Plot of fitted model or distribution. |
| Rank abundance | Plot of fitted model on a rank/abundance plot. This is only available for the geometric series, Zipf and Zipf-Mandelbrot models. |
See also
- Species Abundance Models menu
- Species Abundance Models Save Options menu
- ECFIT procedure
- Species Abundance Plots menu