Select menu: Graphics | Bland-Altman Plot
Use this to specify data for a Bland-Altman plot. A Bland-Altman plot provides a better visual representation than a scatter plot of the differences between two measures of the same quantity. In a scatter plot, the differences from the 1-1 line must be read diagonally and the axes are scaled to show the range of the variates, whereas in a Bland-Altman plot the differences are read on a vertical scale, and the y-axis range is in terms of the differences rather than the original variates range, making for more accurate visual assessments.
For example, if you had an existing test and wanted to compare it with a new test, this plot lets you examine the differences between the two tests in terms of bias and variability. Ideally, the points should lie within a rectangle arranged symmetrically around the x-axis i.e. similar amounts of scatter above and below the line of zero difference.
- After you have imported your data, from the menu select
Graphics | Bland-Altman Plot. - Fill in the fields as required then click Run.
You can set additional options and axis settings by clicking the Options, Symbol and Lines, X Axis, Y Axis and Frame tabs.
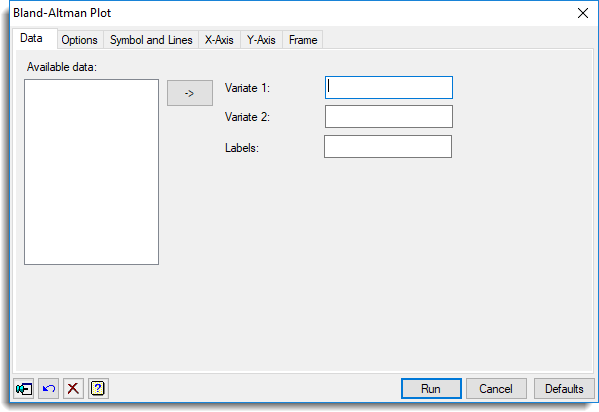
Available data
This lists data structures (variates and texts) appropriate to the current input field. Double-click a name to copy it to the current input field or type the name.
Variate 1
Specifies the coordinates of the first of the variates to be contrasted. Double-click a name in the Available data field to copy it across or type the name. It doesn’t matter which variate is put in as the first or second variate – the graph will be the same in either case.
Variate 2
Specifies the coordinates of the second of the variates to be contrasted. Double-click a name in the Available data field to copy it across or type the name.
Labels
This optionally specifies a text giving labels to be displayed alongside points in the graph. Double-click a name in the Available data field to copy it across or type the name.
Action buttons
| Run | Produce the graph. |
| Cancel | Close the dialog without further changes. |
| Defaults | Reset options to their default settings. |
Action Icons
| Pin | Controls whether to keep the dialog open when you click Run. When the pin is down |
|
| Restore | Restore names into edit fields and default settings. | |
| Clear | Clear all fields and list boxes. | |
| Help | Open the Help topic for this dialog. |
See also
- Bland-Altman Plot options tab menu
- Bland-Altman Plot symbol and lines tab menu
- Y axis, X axis and Frame options.
- Probability Distribution Plot menu for plotting distributions
- 2D Scatter Plot
- BLANDALTMAN procedure