Select menu: Graphics | Multivariate | Biplot
This produces a graphical representation of the relationships between data units and variates.
- After you have imported your data, from the menu select
Graphics | Multivariate | Biplot.
OR
Stats | Multivariate Analysis | Biplot. - Fill in the fields as required then click Run.
You can set additional options by clicking the Options and Frame tabs.
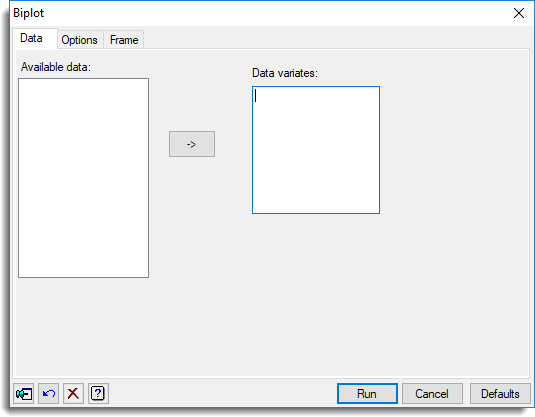
Available data
This lists data structures appropriate to the current input field. It lists variates for specifying the data. The contents will change as you move from one field to the next. Double-click a name to copy it to the current input field or type the name.
Data variates
Specifies variates containing the data values. Double-click a name in the Available data field to copy it across or type the name. You can transfer multiple selections from Available data by holding the Ctrl key on your keyboard while selecting items, then click ![]() to move them all across in one action.
to move them all across in one action.
Action buttons
| Run | Produce the graph. |
| Cancel | Close the dialog without further changes. |
| Defaults | Reset options to their default settings. |
Action Icons
| Pin | Controls whether to keep the dialog open when you click Run. When the pin is down |
|
| Restore | Restore names into edit fields and default settings. | |
| Clear | Clear all fields and list boxes. | |
| Help | Open the Help topic for this dialog. |