Use this to set attributes to control the appearance of a biplot.
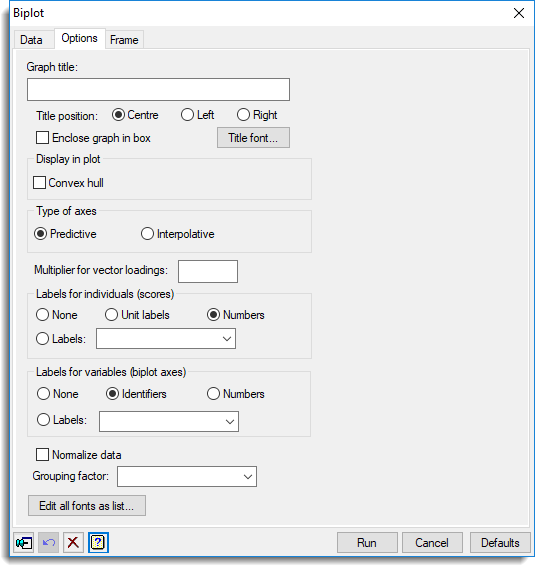
Graph title
Lets you enter a title for the graph. The title appears centred at the top of the graph.
Title position
You can position the title by selecting the Centre, Left or Right option.
Enclose graph in box
Select this to draw an enclosing box around the biplot.
Title font
This opens the Edit Font menu that lets you control the font for the title.
Display in plot
Specifies additional items to display in the graph. Convex hull draws a convex hull around the scores.
Type of axes
Lets you select either Predictive or Interpolative axes.
Multiplier for vector loadings
Arrows are plotted on the axes to represent their loadings (or inverse loadings); the loadings show the approximate contribution of each variable in the first two dimensions. If the loadings are all close to the origin, they are multiplied by a scalar to make them easier to read. By default, the multiplier is calculated automatically, but you can supply a specific value using this option.
Labels for individuals
Can be used to specify what type of labels to use to identify the individuals on the plot. Select Numbers to display the unit numbers, None for no labels, Unit labels to display the unit labels, or Labels to supply alternative labels using the name of a text structure in the space provided.
Labels for variables
Can be used to specify what type of labels to use to identify the variates on the plot. Select Numbers to display the sequential numbering of the variates, None for no labels, Identifiers to display the identifier names, or Labels to supply alternative labels using the name of a text structure in the space provided.
Normalize data
Select this to centre normalize the data (to unit sum of squares) prior to plotting.
Grouping factor
This specifies a grouping factor that can be used to identify groupings of individuals by plotting the groups using different colours.
Edit all fonts as a list
Clicking this opens the Edit All Fonts as a List dialog which allows all the fonts in the graph to be set in one place.
Action buttons
| Run | Produce the graph. |
| Cancel | Close the dialog without further changes. |
| Defaults | Reset options to their default settings. |
Action Icons
| Pin | Controls whether to keep the dialog open when you click Run. When the pin is down |
|
| Restore | Restore names into edit fields and default settings. | |
| Clear | Clear all fields and list boxes. | |
| Help | Open the Help topic for this dialog. |
See also
- Biplot data menu
- Edit Font dialog
- Edit All Fonts as a List
- The DBIPLOT procedure