Select menu: Graphics | Ecology | Species Accumulation Curves
Use this to produce species accumulation and rarefaction curves.
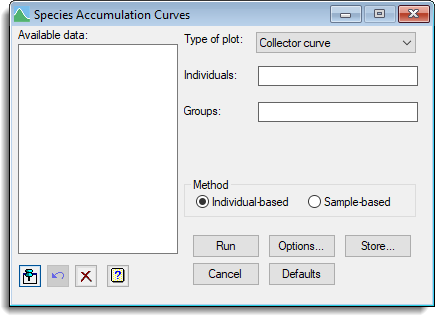
- After you have imported your data, from the menu select
Graphics | Ecology | Species Accumulation Curves. - Fill in the fields as required then click Run.
You can set additional Options and store the results by clicking Store.
Species accumulation curves show the rate at which new species are found within a community and can be extrapolated to provide an estimate of species richness. The simplest type of species accumulation curve is the Collector Curve. This plots the cumulative number of species recorded as a function of sampling effort (i.e. number of individuals collected or cumulative number of samples). The order in which samples are included in a species accumulation curve will influence the overall shape. A smooth accumulation curve can be produced by repeating a process of randomly adding the samples to the accumulation curve and then plotting the mean of these permutations. This menu can produce these type of species accumulation curves and can plot a Coleman curve of the expected number of species.
Rarefaction is a method that can estimate the number of species that would be found if sampling effort was reduced to a specified level. This then allows comparisons amongst communities where sampling effort is unequal. Rarefaction curves are viewed as moving from right to left, whereas species accumulation curves move from left to right.
Available data
This lists data structures appropriate to the current input field. The contents will change as you move from one field to the next. You can double-click a name to copy it to the current input field or type the name.
Type of plot
Controls the type of plot that is to be produced. You can select either Collector curve, Random, Coleman curve or Rarefaction.
Method
Specifies the method for the plot. For the Collector and Rarefaction curves you can select between Individual- and Sample-based methods.
Individual-based method
For individual-based methods the data can be supplied using the following options:
| Individuals | For a Collector curve this specifies a factor or variate containing the individuals in the order that were collected. For Rarefaction this specifies a variate containing the number of individuals for each species. |
| Groups | For the Collector curve method this specifies a grouping factor for samples. |
Sample-based method
For sample-based methods you can supply the data using the following options:
| Samples | For multiple samples this lets you specify one or more variates containing the individuals for different samples. You can transfer multiple selections from the Available data list by holding the Ctrl key on your keyboard while selecting items, then click |
Action buttons
| Run | Run the analysis. |
| Cancel | Close the dialog without further changes. |
| Options | Opens a dialog where you can specify additional options and settings for the graph. |
| Defaults | Reset options to the default settings. Clicking the right mouse on this button produces a shortcut menu where you can choose to reset the menu using the currently stored defaults or the Genstat default settings. |
| Store | Opens a dialog where you can store results from the analysis. |
Action Icons
| Pin | Controls whether to keep the dialog open when you click Run. When the pin is down |
|
| Restore | Restore names into edit fields and default settings. | |
| Clear | Clear all fields and list boxes. | |
| Help | Open the Help topic for this dialog. |
See also
- Species Abundance plots menu
- ECACCUMULATION procedure
- ECRAREFACTION procedure