This menu lets you save results for a species accumulation or rarefaction curve. These results are saved when the graph is run and should be specified before generating the plot.
- After selecting the appropriate boxes, type the names for the identifiers of the data structures into the corresponding In: fields.
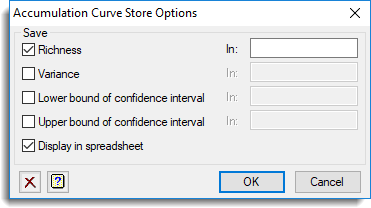
The image below shows the store options when Sample-based is selected on the previous dialog.
Save
The available save options for each type of test are as follows:
| Collector, Random and Coleman curves | ||
| Richness | Variate | Stores observed number of species for the collector method and the average or expected number of species at each sample size for the Coleman and Random methods |
| Variance | Variate | Stores the variance for the richness (Coleman and Random methods only) |
| Rarefaction | ||
| Richness | Variate | Stores the expected species richness |
| Variance | Variate | Stores the variance for the expected richness |
| Lower bound of confidence interval | Scalar | Stores the lower bound of the confidence interval |
| Upper bound of confidence interval | Scalar | Stores the upper bound of the confidence interval |
Display in spreadsheet
Select this to display the results in a new spreadsheet window.
Action Icons
| Clear | Clear all fields and list boxes. | |
| Help | Open the Help topic for this dialog. |