Use this to add an error bar to an existing graph open in the graphics viewer. This uses the DERRORBAR procedure.
- From the menu select Graphics | Add to Graph | Error bar.
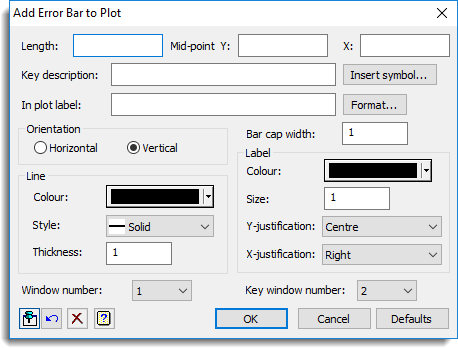
Length
This specifies the length of the bar to be added to the plot, in the same coordinates as used by the X and Y values in the plot (depending on the Orientation of the error bar).
Mid-point Y and X
Lets you specify where the error bar is centred in the plot. The mid-point of the error bar will be plotted at the given Y and X value. If these are not set, a vertical bar will be plotted just inside the left-hand side of the window, and a horizontal bar will be plotted at the bottom of the window.
Key description
This specifies a description that will be added to the key of the current plot. Leave this blank, if you do not want to add an extra entry to the key
In plot label
This specifies a label that will be added to the current plot alongside the error bar. The location of the label relative to the error bar is set in the Label section of the menu using the Y-justification and X-justification options. Other options there let you control the colour and size of the label. Leave this blank, if you do not want to add a label to the plot.
Insert symbol
This opens the Insert Symbol menu where you can add Greek and mathematical symbols or line breaks into the Key description or In plot label fields. The symbols will be added to the field that last had focus.
Format
This opens the Format Text menu where you can format text (bold, italic, subscript, superscript) in the Key description or In plot label fields. If only part of the text is selected, only that selection will be formatted or replaced. The format will be applied to the field that last had focus.
Orientation
Specifies the orientation of the error bar. You can select either Horizontal or Vertical.
Bar cap width
Specifies an amount by which to multiply the standard width caps plotted at the ends of the error bar. The value 1 represents the standard width, a value of zero will remove the bar caps.
Line colour
Lets you select the colour of the error bar.
Line style
Lets you select from a list of line styles. This style is used to plot the line in the error bar.
Line thickness
Specifies an amount by which to multiply the standard thickness of the plotted lines. The value 1 represents the standard thickness.
Label colour
Lets you select the colour of the label.
Label size
Lets you select the size of the font used for the label. The default size is 1 and a value of 2 will double the height of the font, and a value of 0.5 will halve the font height.
Label Y-justification
Specifies how the label is placed relative to the error bar in the Y direction.
| Below | Places the label above the bar |
| Centre | Centres the label around the bar |
| Above | Places the label below the bar |
Label X-justification
Specifies how the label is placed relative to the error bar in the X direction.
| Left | Places the label to the left of the bar |
| Centre | Centres the label around the bar |
| Right | Places the label to the right of the bar |
Window number
Defines the window where the error bar is to be added. If no previous graph has been plotted in this window, then an error bar cannot be displayed.
Action buttons
| Run | Add the error bar to the plot. |
| Cancel | Close the dialog without further changes. |
| Defaults | Close the menu without further changes. |
Action Icons
| Pin | Controls whether to keep the dialog open when you click Run. When the pin is down |
|
| Restore | Restore names into edit fields and default settings. | |
| Clear | Clear all fields and list boxes. | |
| Help | Open the Help topic for this dialog. |
See also
Add Text to Plot dialog
Add Reference Line to Plot dialog
Add Arrow to Plot
Create Graph
Graphics Menu
DERRORBAR procedure