Graphs created in Excel can either be embedded in a spreadsheet or added on a separate chart page in the workbook. These graphs will dynamically update if the data is changed.
Graphs created in Genstat are not dynamic and cannot be stored in the spreadsheet; instead graphs are displayed in a separate Graphics Viewer window.
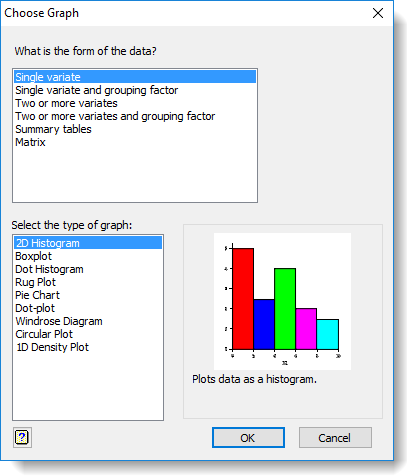
The Choose Graph dialog (select Graphics | Create Graph) lets you create a graph based on the type of data you are using. You can save a graph in different formats and edit the display attributes (fonts, colours, symbols, line styles, etc.) by double-clicking on the graph and using the various edit options. Help buttons are provided on each page of the dialog: click ![]() to see descriptions of each field and how to use them.
to see descriptions of each field and how to use them.