Use this tab in the graphics menus to set the size and fonts (colours and names) of items to control the appearance of the text in a graph. The items which are displayed in the dialog depend on the type of graph. For example, only if it is a 3D graph will the font of the Z-axis title and labels be able to be set. The Text sizes can be set by typing in the values or using the spin buttons. The Font colours can be changed by clicking the buttons. The Font name can be changed by selecting one from the drop down list. The default font (name and colour) and sizes for these are controlled by the current graphics environment which can be set in the Graphics Environment menu.
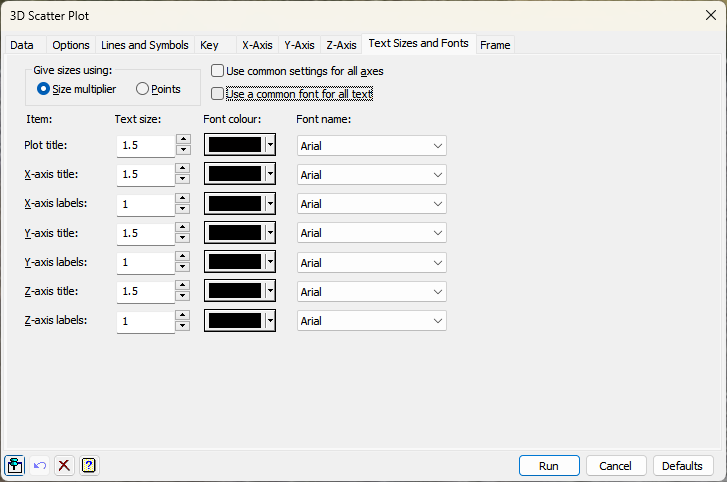
Give sizes using
By default Genstat uses a Size multiplier setting to control the size of text, with 1 being the standard size. A value of 2 will give text twice as large as the standard, and 0.5 will give text half the size of the standard. You can set the text sizes with the more usual Points scale, but this is only approximate, as it assumes the graph will occupy a full A4 page and the resulting size in a report will depend on the scaling of the graph on the printed page.
Use common settings for all axes
When this is selected, you only need to set the properties for the X-axis title and labels and the same attributes will be used for the Y- and Z-axes.
Use a common font for all text
When this is selected, you only need to set the font for the first item, and all other items will use the same font.
Item
The graph text items that can have their sizes and fonts set with this dialog are:
Overall title
This controls the title at the top of panel plots like Trellis Plot and Scatter Plot Matrix. The titles for each individual plot within the array of plots is controlled by the Plot title item.
Plot title
This controls the title for an individual plot. The position of the title can be controlled in the Frame options tab. The default settings for this are set in the Graphics Environment Frame tab.
(X/Y/Z)-axis title
This controls the title of the specified axis (X-axis, Y-axis or Z-axis). Where these cannot be set individually (e.g. in a dot-histogram), there are no X/Y/Z axis title items, and the settings apply all axes of the plot. The default settings for this are set in the Graphics Environment Axis tab.
(X/Y/Z)-axis labels
This controls the labels of the specified axis (X-axis, Y-axis or Z-axis). Where these cannot be set individually (e.g. in a dot-histogram), there are X/Y/Z axis label items, and the settings apply to all axes of the plot. The default settings for this are set in the Graphics Environment Axis tab.
Labels for points
This controls the font for labels plotted with the points in some graphs. The size and colour of the points are set in the Line and Symbols options for each series of plots plotted, and there so is no size or colour option with this item.
Text size
This is a numeric value that gives the size of the font as a multiplier of the standard Genstat font height or as an approximate number of points, depending on the selection in Give sizes using. This must a positive number and can be at most a multiplier of 20 or 100 points. Clicking the up or down button of the spin control next to the size fields will move the values up or down.
Font colour
This gives the colour of the font. Clicking the colour button in a cell will open a colour palette dialog that lets you select one of the standard colours, or use the Windows colour picker to choose a custom colour.
Font name
These drop down lists give the fonts available on the computer. Use the drop down arrow to select a new font.
See also
- Edit font window
- Graphics Colours
- Graphics Environment menu
- Graphics menus
- Graphics tab of Tools Options where the default font can be set
- Axis options
- Line and Symbols options
- Key tab menu
- Frame options
- DFONT, PEN directives
- DHELP procedure