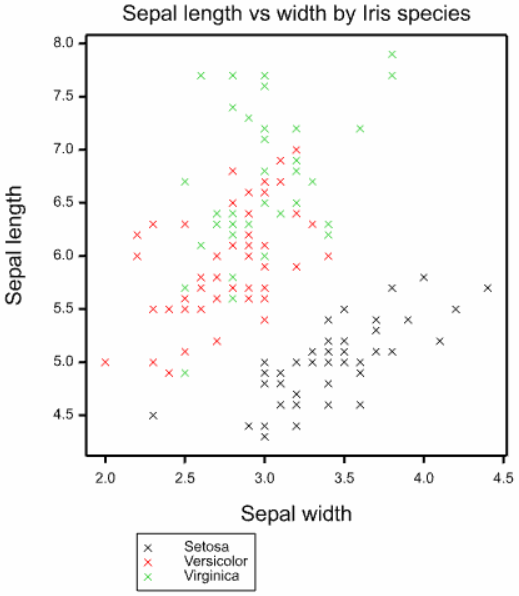
Genstat comes with 6 standard graphics environments which set up the standard look and feel of the plots created by the Genstat menus. This sets the default fonts, colours, symbols, line styles and axes used by the menus.
You can create and select graphics environments using the Tools | Graphics environments menu.
You can create and load graphics environment files in the command language using the DLOAD and DSAVE directives.
The 6 standard environments are described below:
| Genstat default environment | The server’s default settings using crosses for symbols and standard size fonts. |
| Grayscale graphics | Uses no colours, just grey colours ranging from black to white. |
| Bold symbols and lines | Uses strong colours with filled in symbols and thicker lines and larger fonts. |
| Microsoft Excel 2003 style graphics | Uses the style of Excel 2003 with a coloured graph region and Y-axis grid lines. |
| Microsoft Excel 2010 style graphics | Uses the style of Excel 2010 with pastel colours and more subtle Y-axis grid lines. |
| R style graphics | Uses the style of R with pastel colours, circle symbols and smaller sized fonts. |
Example plots using the 6 standard graphics environments can be seen below:
Genstat default environment

Grayscale graphics

Bold symbols and lines

Microsoft Excel 2003 style graphics

Microsoft Excel 2010 style graphics

R style graphics

See also
- Graphics environments
- Graphics Environment – Axis tab menu
- Graphics Environment – Axis tab menu
- Graphics Environment – Key tab menu
- Graphics Environment – Grid tab menu
- Graphics Environment – Frame tab menu
- Graphics Environment – Outlines tab menu
- Graphics Environment – Symbols tab menu
- Graphics tab of the Tools Options menu
- Edit font
- DLOAD directive
- DSAVE directive