Select menu: Tools | Graphics environments
Use this to create and edit graphics environment files. A graphics environment file contains commands that specify exactly how a graph is produced. It controls aspects such as whether or not boxes are drawn around the plots, the display of the key, and the styles and colours of outlines for graphs such as histograms or shade plots. The aspects of the environments are as follows: Axis, Key, Grid, Frame, Outlines and Symbols.
You can create and load graphics environment files in the command language using the DLOAD and DSAVE directives.
The graphics environment files (*.ggd) are located in a sub-folder of the add-ins folder called graphics. There are two types of add-in folders: system and user. To make a graphics environment file system wide, i.e. to all users that have access to Genstat on a network server or on a local machine, place the file in the graphics sub-folder of the system add-in folder called AddIns within the Genstat installation. Alternatively, to make the graphics environment file only available to the current user, place the file within the user add-in folder.
You can set the location of the user add-in folder from the menu by selecting Tools | Options then select the General tab. Here you can select a current graphics environment to use for graphs within the current session and also to be loaded whenever Genstat starts.
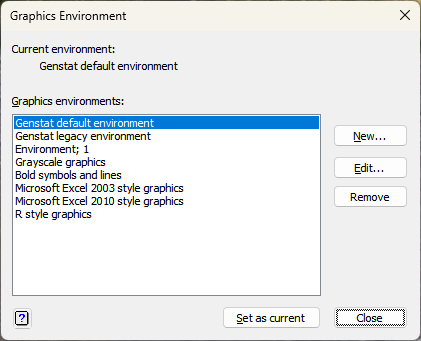
Current environment
This displays the description of the graphics environment that is currently active in your session.
Graphics environments
This lists all the available graphics environments files that are stored in the graphics sub-folder of the add-ins folder in Genstat. The environments are displayed using their descriptions. Note that graphics environment files stored in the system folder can be amended or deleted only if you have the correct write permission to the folder. The previous colours and symbols for versions 23 and earlier can be selected by choosing the Genstat legacy environment option.
Example plots using the standard graphics environments distributed with Genstat can be found here.
| New | Lets you create a New Graphics Environment to save within the add-ins folder. |
| Edit | Lets you edit the selected graphics environment. |
| Remove | Deletes the selected graphics environment and the associated file from the add-ins folder. |
Genstat provides some standard graphics environments within the system add-ins folder. These include environments in the style of Excel or R graphics.
Action buttons
| Set as current | Loads the selected graphics environment as the current for the session. The selected environment will also be loaded each time that Genstat is started. |
| Close | Close the dialog without further changes. |
See also
- New Graphics Environment dialog
- Graphics Environment – Axis tab menu
- Graphics Environment – Key tab menu
- Graphics Environment – Grid tab menu
- Graphics Environment – Frame tab menu
- Graphics Environment – Outlines tab menu
- Graphics Environment – Symbols tab menu
- Standard Graphics Environments
- Graphics tab of the Tools Options menu
- Graphics Colours
- Edit font
- DLOAD directive
- DSAVE directive