Use this to set attributes to control the appearance of a histogram.
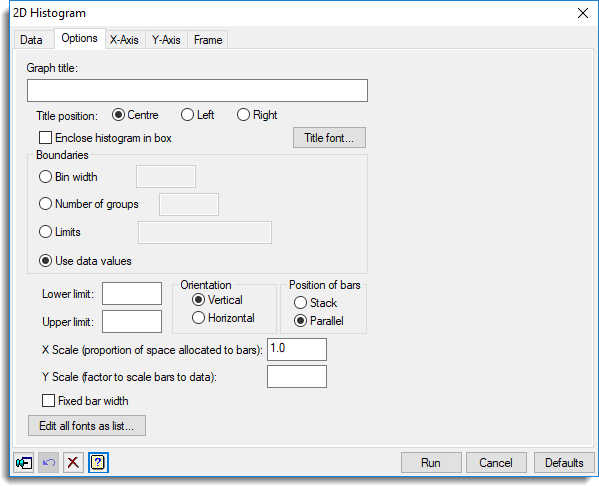
Graph title
Lets you enter a title for the graph. The title appears centred at the top of the graph.
Title position
You can position the title by selecting the Centre, Left or Right option.
Enclose histogram in box
Select this to draw an enclosing box around the graph.
Title font
This opens the Edit Font dialog that lets you control the font for the title.
Boundaries
Lets you define the boundaries for the bars in the histogram. You can specify the boundaries of each of the bars by selecting Limits and entering a list of the values in the space provided. Similarly, you can specify the width of the individual bins by selecting Bin width and entering the values into the space provided there. Alternatively, you can specify the number of groups by selecting Number of groups or let Genstat define the boundaries by selecting Use data values. In this case the number of groups is either set to be 10, or the integer value nearest to the square root of the number of values in the first data variate if that is smaller.
Lower limit
This specifies the lower limit of the first bar. The default takes the minimum value of the data as the lower limit.
Upper limit
This specifies the upper limit of the last bar. The default takes the maximum value of the data as the upper limit.
X Scale
Specifies what proportion of the space allocated along the x-axis each bar should occupy. The default is 1.0, i.e. no space between the bars.
Y Scale
Specifies the width of the bars for which one unit of bar length represents one unit of data. The default uses the width of the narrowest bar.
Orientation
Lets you specify the orientation of the plot. You can select either Horizontal or Vertical.
Fixed bar width
Specifies whether to plot the histogram with bars of equal width.
Position of bars (Multiple histograms)
For multiple histograms you can control the appearance of the groupings of the bars using this option. Select Stacked if you want the bars to be stacked on top of each other, or Parallel if you want them to be displayed side by side.
Edit all fonts as a list
Clicking this opens the Edit All Fonts as a List dialog which allows all the fonts in the graph to be set in one place.
Action buttons
| Run | Produce the graph. |
| Cancel | Close the dialog without further changes. |
| Defaults | Reset options to their default settings. |
Action Icons
| Pin | Controls whether to keep the dialog open when you click Run. When the pin is down |
|
| Restore | Restore names into edit fields and default settings. | |
| Clear | Clear all fields and list boxes. | |
| Help | Open the Help topic for this dialog. |
See also
- Histogram data tab menu
- Edit font dialog
- Edit All Fonts as a List
- DHISTOGRAM directive