Use this to set attributes to control the appearance of a table plot.
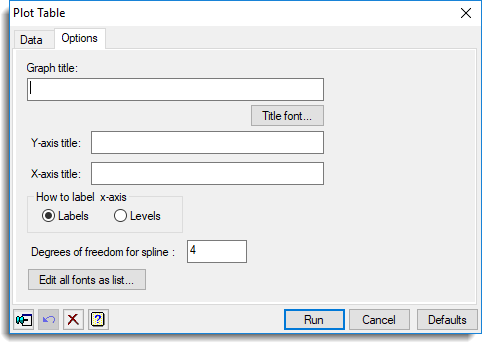
Graph title
Lets you specify a title for the plot. The title appears centred at the top of the graph.
Title font
This opens the Edit Font dialog that lets you control the font for the title.
Y-axis title
Lets you specify a title for the y-axis of the plot. The title appears centred, parallel to the y-axis of the graph.
X-axis title
Lets you specify a title for the x-axis of the plot. The title appears centred, parallel to the x-axis of the graph.
How to label x-axis
Lets you specify the labels on the x-axis. You can select either to label the groups with the factor’s Labels (text associated with each group) or Levels (the numerical values associated with each group).
Degrees of freedom for spline
This lets you set the flexibility of the smooth spline curve that follows the points in each plot, when using the Splines method of plotting. A smaller value will make the curve smoother, and a larger value will make the curve more flexible. The degrees of freedom must be greater than or equal to 1.
Action buttons
| Run | Produce the graph. |
| Cancel | Close the dialog without further changes. |
| Defaults | Reset options to their default settings. |
Action Icons
| Pin | Controls whether to keep the dialog open when you click Run. When the pin is down |
|
| Restore | Restore names into edit fields and default settings. | |
| Clear | Clear all fields and list boxes. | |
| Help | Open the Help topic for this dialog. |
See also
- Plot table data tab for this menu
- Edit font dialog
- DTABLE procedure