Select menu: Stats | QTLs (linkage/Association) | Data Exploration | Phenotypic Data | Summary Statistic Multi-traits
Use this to produce a scatter plot matrix and correlations for trait means for a selection of traits. The scatter plot matrix and correlations can be evaluated for a single environment or averaged over multiple environments.
- After you have imported your data, from the menu select
Stats | QTLs (linkage/Association) | Data Exploration | Phenotypic Data | Summary Statistic Multi-traits. - Fill in the fields as required then click Run.
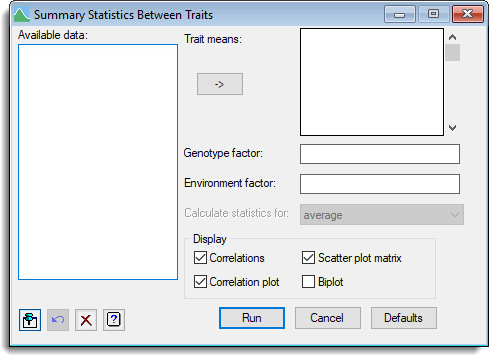
Available data
This lists data structures appropriate to the current input field. Double-click a name to copy it to the current input field or type the name. If data has been stored in a QTL data space then only the data structures present within the data space will be displayed in the available data, otherwise all the current data within Genstat will be displayed. When data are present within the QTL data space you can right-click on the Available data list to open a shortcut menu where you can change between displaying data only within the data space and all data within Genstat.
Trait means
A list of variates specifying the trait means to be used in the scatter plot matrix and the calculation of the correlations.
Genotype factor
A factor specifying the genotypes for the traits.
Environment factor
A factor specifying the different environments. When the environment factor is selected its levels or labels will be displayed in the Calculate statistics for list where you can select an environment or average to calculate statistics averaged over all environments.
Display
This specifies what summary statistics are displayed.
| Correlations | Calculates the correlations between the traits. |
| Correlation plot | Produces a shade plot of the correlations. |
| Scatter plot matrix | Produces a scatter plot matrix between the traits . |
| Biplot | Produces a biplot. |
Action buttons
| Run | Produce the graphs and/or correlations. |
| Cancel | Close the dialog without further changes. |
| Defaults | Reset options to the default settings. Clicking the right mouse on this button produces a shortcut menu where you can choose to set the options using the currently stored defaults or the Genstat default settings. |
Action Icons
| Pin | Controls whether to keep the dialog open when you click Run. When the pin is down |
|
| Restore | Restore names into edit fields and default settings. | |
| Clear | Clear all fields and list boxes. | |
| Help | Open the Help topic for this dialog. |
See also
- Summary statistics menu for summary statistics within environments
- Summary statistics between environments
- QTL data space for using data in QTL dialogs
- QTL analysis using menus
- FCORRELATION procedure for calculating correlations in command mode
- DCORRELATION procedure for plotting correlations matrices in command mode
- DSCATTER procedure for producing a scatter plot matrix in command mode