Use this to set options for forming a tally table of the distinct values in a vector.
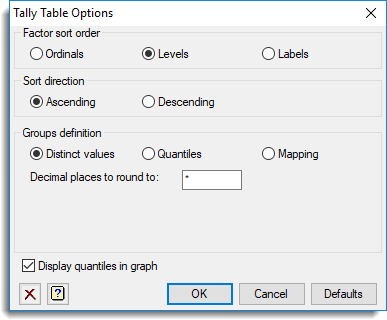
Factor sort order
This controls the items used to sort a factor’s groups within the tally table. If Ordinals is selected, the order will be as defined in the reorder factor levels dialog, if Levels, the factor levels will be sorted in numerical order, and if Labels, the factor labels will be sorted in alphabetical order.
Sort direction
Specifies whether the distinct items are sorted in Ascending (A-Z, 0-9) order or in Descending (Z-A, 9-0) order. The cumulative frequency graph will be plotted using this sort order.
Groups definition
The Distinct values setting puts each unique value (after any rounding) into a unique group. The number of classes in the tally table can be changed for a variate or text by selecting the Quantiles setting. When this is selected an option is enabled where you can specify the Number of groups for the classes. The number of groups must be at least two. The Mapping setting provides another way to form the classes. In this case options are enabled where you can supply a series of Limits. The limits should be entered as an ascending comma or space separated list of numerical values. These limits are used as the cut points for a series of bins, and values between these cut points will be grouped together.
The Boundaries in limits are option specifies whether the limits in the list are Lower or Upper boundaries. The number of groups formed using these limits will be one more group than the number of limits supplied. So, if the limits are lower boundaries, values less the first value in the list will be placed in the first group, values greater than or equal to the first value and less than the second value will be placed in the second group, and so on. Similarly, if the limits are upper boundaries, values less than or equal to the first value will be placed in the first group, values greater the first value and less than or equal to the second value will be place in the second group, and so on.
Decimal places to round to
Specifies the number of decimal places to round to before forming the groups. A missing value * can be used to specify that the groups are formed using the full precision of each value.
Display quantiles in graph
Select this to display quantiles on the graph.
Action buttons
| OK | Save the specified options for creating a tally table and close the dialog. |
| Cancel | Close the dialog without making any changes. |
| Defaults | Reset options to the default settings. |
Action Icons
| Clear | Clear all fields and list boxes. | |
| Help | Open the Help topic for this dialog. |
See also
- Tally table menu
- Tally table save options
- Reordering factor levels
- Understanding factors
- TALLY procedure