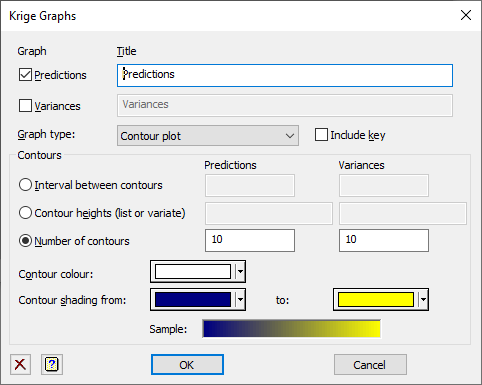
Use this dialog to control the appearance of the graphs from a Krige analysis.

If used before the analysis is performed in the main menu, and the Display Graphs option is set, this controls graphs produced from the Run button. After the analysis has been performed, the selected graphs are produced by clicking OK.
Graph
This lets you select to plot either the Predictions and/or the Variances of the predictions. At least one graph must be selected.
Title
Lets you enter a title for the each graph selected. The title appears centred at the top of the graph.
Graph type
This lets you select the type of graph you wish to plot:
| Contour plot | A contour plot showing contour lines of equal height with shading between the lines. |
| Shade plot | A shade plot representing the values by a shaded rectangles. |
| Surface plot | A surface plot giving a 3 dimensional view of the data. |
Contours/Shade settings
Lets you define the boundaries for the data values for contour or shade. There are two settings for each option, the first for the Predictions plot and the second for the Variances plot. You can specify the boundaries of each of the contours/shades by selecting one of the 3 options: and entering a list of the values in the space provided.
| Interval between contours/changes | A single number which gives the distances between contours or changes of shade. The contours or shades will start from the minimum value and increment each time the value increases by this amount. |
| Contour heights/Boundary values | This gives a variate or list of numbers (space or comma separated) that give the contours or shade changes. |
| Number of contours/groups | The increment between contours/shades will be calculated to give this number of contours or shades. |
Contour colour (contour or surface plot only)
This gives the colour for the contours and their labels in a contour plot or of the contours drawn on a surface plot. Click the button to get a pop up colour dialog to change the colour.
Mesh colour (surface plot only)
This gives the colour for the mesh drawn on the surface plot between points on the surface. Click the button to get a pop up colour dialog to change the colour.
Grid colour (shade plot only)
If the Plot grid options is selected, this gives the colour for the outline drawn around each shade rectangle. Click the button to get a pop up colour dialog to change the colour.
Plot grid (shade plot only)
If this is selected, an outline should be drawn around each shade rectangles creating a grid, otherwise no grid will be drawn.
Contour/Shade Colours from/to
This option lets you specify the two colours used for the starting colour (from) and ending colour (to) for the shading between the contours or the shaded rectangles. Click the buttons to get a pop up colour dialog to change the colours.
Action buttons
| Run | Produce the graph if the Krige analysis has been run. |
| Cancel | Close the window without further changes. |
Action Icons
| Clear | Clear all fields and list boxes. | |
| Help | Open the Help topic for this dialog. |
See also
- Krige menu
- Krige Options
- Krige Store Options
- Form Variogram menu
- Model Variogram menu
- Surface plot menu
- Contour plot menu
- Shade plot menu
- DSURFACE directive
- DCONTOUR directive
- DSHADE directive
- KRIGE directive