Use this to set attributes to control the appearance of a surface plot.
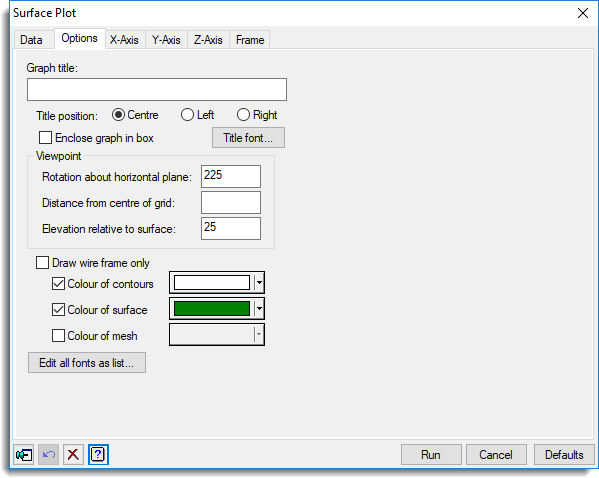
Graph title
Lets you enter a title for the graph. The title appears centred at the top of the graph.
Title position
You can position the title by selecting the Centre, Left or Right option.
Enclose graph in box
Select this to draw an enclosing box around the graph.
Title font
This opens the Edit Font menu that lets you control the font for the title.
Viewpoint
Specifies the position of the viewpoint, and thus the orientation of the plot. The default values should usually suffice to display the plot clearly, but if, for example, some parts of the surface are hidden you can change them to obtain a better view. The Rotation and Elevation values are specified in degrees; the Distance in the same units as the axes, with a default value of 25 times the number of y points in the grid.
Draw wire frame Only
This option specifies that the surface is drawn as a wire-frame or mesh. You can select a colour for the mesh from the Colour of mesh list. When this option is selected the Colour of contours and Colour of surface options are disabled.
Colour of surface
Specifies the base colour for shading the areas between the contours. The shades are defined in increasing intensities of the selected colour.
Colour of mesh
Specifies which colour is to be used to draw the mesh.
Colour of contours
Controls whether contour lines are to be drawn on the plot. If selected, a list of colours is provided, which lets you set the colour of the contour lines.
Colour of surface
Lets you define the colours used to draw the surface. The surface is coloured according to its height. You can specify the boundaries of each of the colours by selecting Boundary values and entering a list of the values in the space provided. Similarly, you can specify the size of an interval for between the colours by selecting Interval between changes and entering the value into the space provided there. Alternatively, you can specify the exact number of shades by selecting Number of groups.
The colours can be selected using the Intensity of a single colour, or a Spectrum of two colours or a Discrete colour palette. The colour range for the first two cases is displayed in the Sample field. In the later case, you can be select the palette from the drop down list of colour palettes. When Boundary values or Interval between changes are selected, you will also need to specify the Number of intervals needed for the palette.
Edit all fonts as a list
Clicking this opens the Edit All Fonts as a List dialog which allows all the fonts in the graph to be set in one place.
Action buttons
| Run | Produce the graph. |
| Cancel | Close the dialog without further changes. |
| Defaults | Reset options to their default settings. |
See also
- Surface plot data tab menu
- Y axis, X axis and Frame options
- Text Sizes and Fonts options
- Edit font dialog
- Edit All Fonts as a List
- Graphics Menu
- DSURFACE directive