Use this to produce predictions of the values of the response variate at particular values of the variables in the fixed or random mixed models.
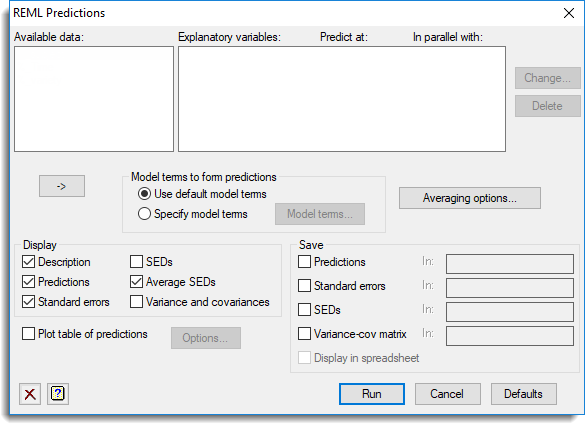
Available data
This lists the model terms which can be used to form predictions. Double-click a name to copy it to the Explanatory variables list. You can transfer multiple selections from Available data by holding the Ctrl key on your keyboard while selecting items, then click ![]() to move them all across in one action.
to move them all across in one action.
Explanatory variables
This list contains all the variables that are to be used to form the predictions. The list contains three columns; variable name, values to predict at and the variable that it is parallel with. To change the prediction values for a variable in the list either double-click on the variable name or click the Change values button.
Change values
This opens a submenu where you can change the values that are to be predicted for each of the variables listed in Explanatory variables.
Delete
This removes the currently selected variable from the Explanatory variables list.
Model terms for predictions
Controls which model terms (fixed and/or random) are to be used in forming the predictions. Select Use default model terms to use the default model terms (i.e. all the fixed terms and relevant random terms). Alternatively, select Specify model terms to specify the model terms to be used. The model terms must be specified by clicking the Model terms button to open a submenu where the relevant model formula can be constructed.
Averaging options
Lets you specify additional averaging options to use when forming predictions.
Display
Specifies the output to be displayed.
| Description | Describes the terms and standardization policies used when forming the predictions. |
| Predictions | Displays the predictions. |
| Standard errors | Produces predictions and standard errors. |
| SEDs | Standard errors for differences between the predictions. |
| Average SEDs | Displays the average standard error of difference of the predictions. |
| Variance and covariances | Displays the variance and covariances of the predictions. |
Save
This lets you save results from the prediction in Genstat data structures. After selecting the appropriate boxes, type the names for the identifiers of the data structures into the corresponding In: fields.
| Predictions | Table or scalar | Contains the predictions |
| Standard errors | Table or scalar | Contains the standard errors of the predictions |
| SEDs | Symmetric matrix | Contains standard errors of differences between predictions |
| Variance-cov matrix | Symmetric matrix | Contains variances and covariances of predictions |
Display in spreadsheet
Select this to display the results in a new spreadsheet window.
Plot table of predictions
If this is selected, the predictions will be plotted. The Options button opens the Plot table of predictions dialog which controls how the predictions are plotted. You need to complete the Explanatory variates list before using the Options button.
See also
- Averaging Options for specifying additional averaging options
- Model Terms for specifying model terms to form the predictions
- Plot table of predictions
- VPREDICT directive for forming predictions in command mode