This sets attributes of the pen used to draw the grid lines.
- Double-click your graph then click the Axis tab for the line you want to change (X Axis, Y Axis or Z Axis).
- Click the Grid pen button.
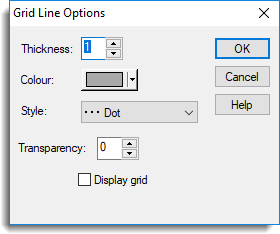
Thickness
Sets the thickness of the line used to draw the grid lines. You can use the up and down arrows to cycle through integer values in the range 1 to 5. Other values, including fractional values, can be typed in directly.
Colour
Displays or modifies the current colour setting for the line.
Style
Sets the grid line style. A dotted line is usually used, but you can also choose between Solid, Dot, Dash, Dot dash, Tight dash, Long dash, Short dash, Close dot, Fine dot, and Double dot dash to obtain other effects.
Transparency
Sets the transparency for the line. You can use the up and down arrows to cycle through integer values in the range 0 (opaque) to 255 (completely transparent).
Display grid
Controls whether grid lines are displayed. These are drawn at the major tick positions on the x-axis, parallel to the y-axis.