Use this to edit a set of user-defined tick marks. Major tick marks are drawn at the positions listed, along with a corresponding set of labels used to mark the axis. If user-defined tick marks were not specified when the graph was originally plotted, the positions are generated automatically along with a set of numeric labels. Note that any text or numeric value can be used when editing the labels.
- Double-click your graph then select the relevant Axis tab (Y Axis, X Axis or Z Axis).
- In the Display tick marks section click User, then click the Edit values button.
To edit a tick mark you need to select it from the list. It will then be highlighted to show that it is the current tick mark. You can then change the position and label as required before replacing the original values or adding it as a new tick mark.
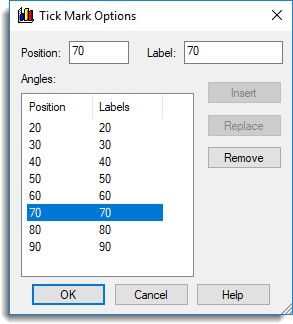
Position
Indicates the position of the current tick mark.
Label
Displays the label for the current tick mark.
Insert
Having changed the position value for the current tick mark you can use Insert to add a new entry to the list.
Replace
Replace the current tick mark with the one specified in Position and Label.
Remove
Removes the current tick mark from the list.