This provides overall control for the bar chart.
- Double-click your graph then click the Barchart Options tab.
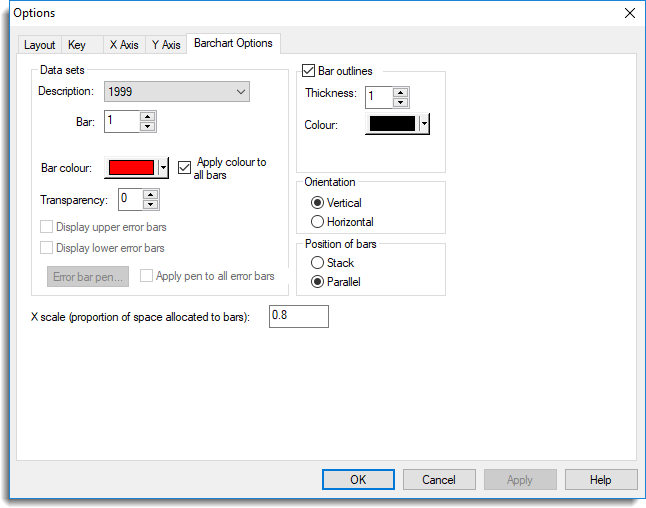
Data sets
This lets you set the colour and transparency of the bars and control the display of the error bars, if present. 0 is opaque and 255 is completely transparent.
Bar outlines
This lets you control the display of the bar outlines.
X scale
This is a scaling factor applied in the X direction. Each bar is scaled to occupy the specified proportion of the allocated bar width.
For a bar chart, a value less than 1.0 is suggested, so that there is a gap between adjacent bars.
Y scale
This option controls how the heights of the bars correspond to units of data. The height of each bar is calculated as (data-value * y-scale)/bar-width. By default, this value is set to the width of the narrowest bar. So for that bar, the height will correspond directly to the data units.
Orientation
The data scale is defined to be the X values, and the frequencies or bar heights are defined by the Y values. By default, barcharts are plotted with Vertical bars. You can change this to Horizontal if you prefer. However, the group frequencies are still considered to be Y values and the data X values, even though they now appear horizontally and vertically, respectively.
Position of bars
For bar charts of multiple data variates, the bars can be plotted in Parallel or Stacked.