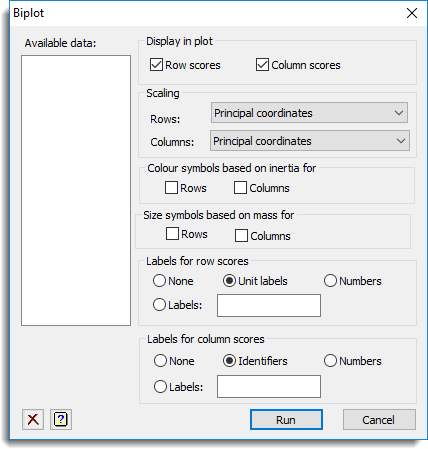
Use this to produce a biplot of the results from correspondence or multiple correspondence analysis.
Available data
This lists data structures appropriate to the current input field. It lists texts for use in specifying the labels for the rows and/or the columns. Double-click a name to copy it to the current input field or type the name.
Display in plot
Specifies which scores to display in the graph.
| Row scores | Plots the row scores obtained in the analysis. |
| Column scores | Plots the column scores obtained in the analysis. |
Scaling
Type of scaling to use when plotting the row scores and column scores.
Row:
| Principal coordinates | Plots the row scores, scaled so that they have inertia equal to the latent roots of the data. |
| Standard coordinates | Plots the row scores, scaled so that they have inertia equal to one. |
| Standard coordinates x row mass | Plots the row standard coordinates multiplied by the row mass. |
| Standard coordinates x sqrt(row mass) | Plots the row standard coordinates multiplied by the square root of the row mass. |
Column:
| Principal coordinates | Plots the column scores, scaled so that they have inertia equal to the latent roots of the data. |
| Standard coordinates | Plots the column scores, scaled so that they have inertia equal to one. |
| Standard coordinates x column mass | Plots the column standard coordinates multiplied by the column mass. |
| Standard coordinates x sqrt(column mass) | Plots the column standard coordinates multiplied by the square root of the column mass. |
Note that at least one of the row or column lists has to be set to principal coordinates.
Colour symbols based on inertia for
Whether the colour of the row and/or column scores is different for differing levels of row and/or column inertia (i.e. smaller inertias cause transparent symbols to be plotted).
Size symbols based on mass for
Whether the size of the symbol for the row and/or column scores is different for differing row and/or column masses (i.e. larger masses produce larger symbols).
Labels for row scores
Can be used to specify what type of labels to use to identify the row scores on the plot. Select Numbers to display the unit numbers, None for no labels, Unit labels to display the unit labels, or Labels to supply alternative labels using the name of a text structure in the space provided.
Labels for column scores
Can be used to specify what type of labels to use to identify the column scores on the plot. Select Numbers to display the unit numbers, None for no labels, Unit labels to display the unit labels, or Labels to supply alternative labels using the name of a text structure in the space provided.
Action Icons
| Clear | Clear all fields and list boxes. | |
| Help | Open the Help topic for this dialog. |
See also
- Correspondence analysis menu for correspondence analysis
- Multiple correspondence analysis menu for multiple correspondence analysis
- CABIPLOT procedure in command mode