Select menu: Stats | Multivariate Analysis | Canonical Correspondence Analysis
Use this to perform a canonical correspondence analysis. Canonical correspondence analysis (CCA) is the canonical form of correspondence analysis. It is similar to redundancy analysis. However, in CCA, a weighted multiple regression is applied to a transformed data matrix with the fitted values subjected to correspondence analysis.
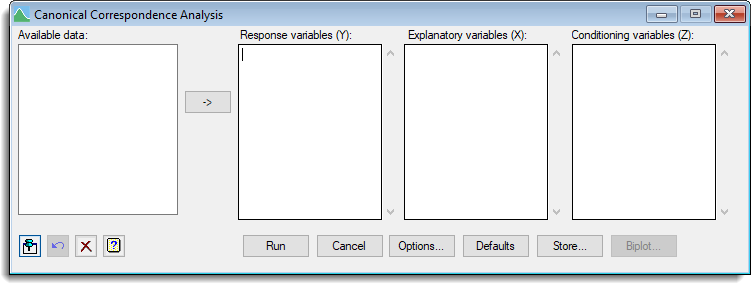
Available data
This lists data structures appropriate to the current input field. It lists variates for use in specifying the response variables, explanatory variables and conditioning variables. Double-click a name to copy it to the current input field or type the name..
Response variables (Y)
Used to enter the names of the variates for the response variables to be analysed. You can transfer multiple selections from Available data by holding the Ctrl key on your keyboard while selecting items, then click ![]() to move them all across in one action. If the data are referenced within a pointer you can enter the pointer name directly followed by its elements within squared brackets, e.g. mydata[1,2]
to move them all across in one action. If the data are referenced within a pointer you can enter the pointer name directly followed by its elements within squared brackets, e.g. mydata[1,2]
Explanatory variables (X)
Used to enter the names of the variates of factors for the explanatory variables to be analysed. You can transfer multiple selections from Available data by holding the Ctrl key on your keyboard while selecting items, then click ![]() to move them all across in one action. If the data are referenced within a pointer you can enter the pointer name directly followed by its elements within squared brackets, e.g. mydata[1,2]
to move them all across in one action. If the data are referenced within a pointer you can enter the pointer name directly followed by its elements within squared brackets, e.g. mydata[1,2]
Conditioning variables (Z)
Used to enter the names of the variates or factors containing data for the conditioning variables. When these are supplied partial redundancy analysis will be used where the effect of the these variables is removed before performing the redundancy analysis. You can transfer multiple selections from Available data by holding the Ctrl key on your keyboard while selecting items, then click ![]() to move them all across in one action. If the data are referenced within a pointer you can enter the pointer name directly followed by its elements within squared brackets, e.g. mydata[1,2]
to move them all across in one action. If the data are referenced within a pointer you can enter the pointer name directly followed by its elements within squared brackets, e.g. mydata[1,2]
Action buttons
| Run | Run the analysis. |
| Cancel | Close the dialog without further changes. |
| Options | Opens a dialog where additional options and settings can be specified. |
| Defaults | Resest options to the default settings. Clicking the right mouse on this button produces a shortcut menu where you can choose to set the options using the currently stored defaults or the Genstat default settings. |
| Biplot | Opens a dialog where you can produce a biplot representations of the results, showing projections of species or site scores onto one or two variables. |
| Store | Opens a dialog where you can store results from the analysis. |
Action Icons
| Pin | Controls whether to keep the dialog open when you click Run. When the pin is down |
|
| Restore | Restore names into edit fields and default settings. | |
| Clear | Clear all fields and list boxes. | |
| Help | Open the Help topic for this dialog. |
See also
- Canonical correspondence analysis options for optional settings and display
- Canonical correspondence analysis store options for saving results
- Biplot menu for displaying biplots of results
- Redundancy analysis menu
- CCA procedure in command mode