Select menu: Stats | Multivariate Analysis | Canonical Correlations
Given a data set consisting of two separate sets of variables that have been measured on the same experimental units, Canonical Correlations Analysis may be used to obtain a quantitative measure of associations or relationships between the two sets.
The two sets of variables are denoted P and Q respectively. The analysis finds linear combinations of the P and Q variables, and the correlation between each pair of combinations.
- After you have imported your data, from the menu select
Stats | Multivariate Analysis | Canonical Correlations. - Fill in the fields as required then click Run.
You can set additional Options then after running, you can save the results by clicking Save.
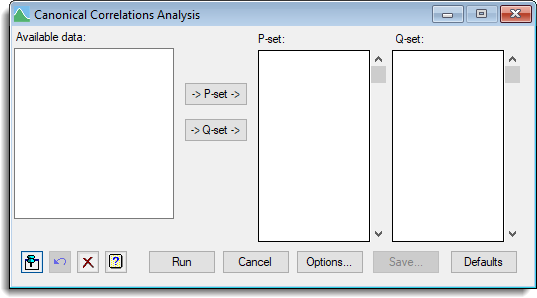
Available data
This lists variates that can be assigned to either the P or Q sets.
P-set
This lists variates selected for the first set. You can transfer multiple selections from Available data by holding the Ctrl key on your keyboard while selecting items, then click ![]() to move them all across in one action, or you can type in variate names.
to move them all across in one action, or you can type in variate names.
Q-set
This lists variates selected for the second set. You can transfer multiple selections from Available data by holding the Ctrl key on your keyboard while selecting items, then click ![]() to move them all across in one action, or you can type in variate names.
to move them all across in one action, or you can type in variate names.
Action Icons
| Pin | Controls whether to keep the dialog open when you click Run. When the pin is down |
|
| Restore | Restore names into edit fields and default settings. | |
| Clear | Clear all fields and list boxes. | |
| Help | Open the Help topic for this dialog. |
See also
- Options for display options
- Save for saving the results in data structures
- CANCORRELATION procedure in command mode for further details of the method