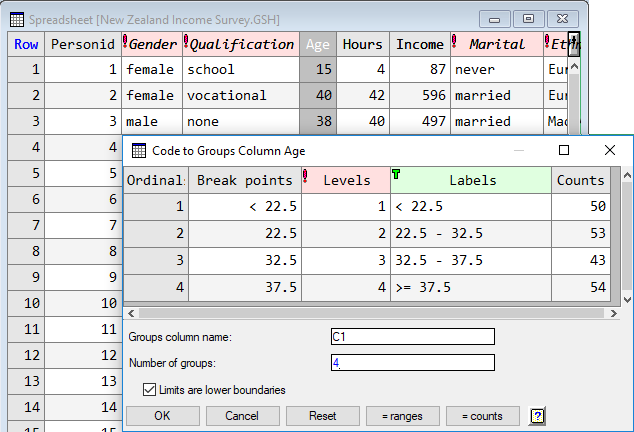
A variate can be used to form groups in a new factor column by splitting its values into several ranges that then become the levels of the new factor. For example, a variate called ‘Age‘ could be split into a number of age ranges, or a variate called ‘Scores‘ could be split into low, average and high scoring ranges.
- Put the cursor in the spreadsheet column you want to use then select Spread | Calculate | Code to Groups.
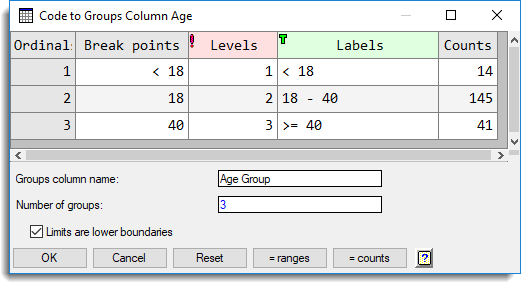
- Enter a name for the new factor column in the Groups column name field.
- Enter the Number of groups you want to create. These will become the levels of your factor.
- Ignore the first Break points cell. In the second cell enter a value below which will divide the first and second range. Repeat for subsequent ranges.
(If you de-select the option Limits are lower boundaries you will need to put in the upper bound of each group, rather than the lower bound, starting from cell 1.).
- Edit the labels to something meaningful or leave them at their defaults (the defaults will display the numeric ranges you specified as break points).
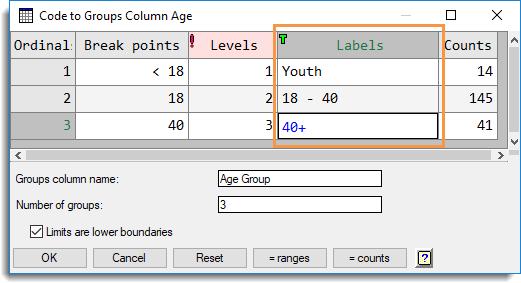
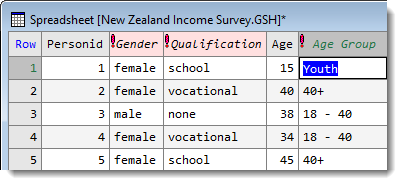
- Click OK to create the new column.
| Break points | Specifies the break points (or limits) that are used to divide the values up into groups. |
| Levels | Specifies the levels that are given to each group. Default values are 1…n. |
| Labels | The labels that are given to each group. Default values are generated from the break points, but you can edit these. |
| Counts | The number of values that will coded to each group with the current break points. The Counts column is provided for information and cannot be changed. |
| Groups column name | Specify the name of the new factor to be created. This may be the name of an existing column, in which case this column is overwritten (after a displaying a warning). |
| Number of groups | Specify the number of groups for the new factor. The number of break points that need to be specified should be one less than the number of groups, but at least 2. |
| Limits are lower boundaries |
When selected, the first group will be defined by the values less than the first Break point (specified in the second row). The first group label is then automatically specified as < this break point e.g. < 18. You can edit the label if required. When this option is not selected, the last group will be defined by the values greater than the last Break point (specified in the second to last row). The last group label is then automatically specified as > this break point e.g. > 40. |
| Reset | Set all editable fields back to their default values. |
| = Ranges | Calculate a set of Break points that are equally spaced over the range of the data. |
| = Counts | Calculate a set of Break points that divide the values into groups of equal size as close to equal counts as possible. |