This menu controls various options relating to the display of contour plots.
- Double-click your graph then click the Contour Options tab.
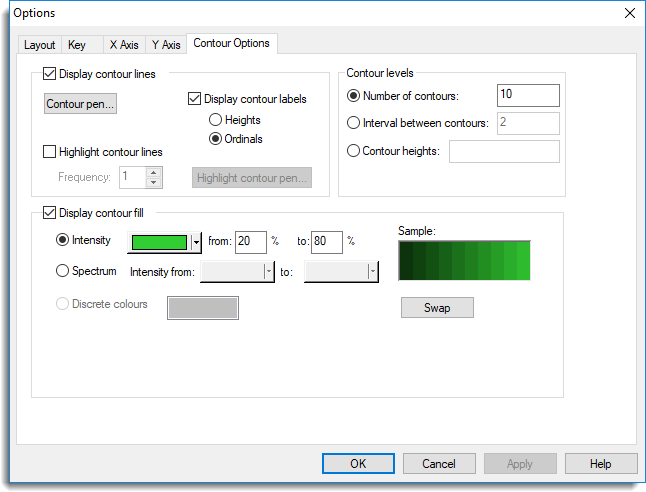
Display contour lines
The surface can be augmented with contour lines joining points with equal Z value. This may help interpretation of the 3-D display. The contour pen can be modified if you want to control the colour or other attributes of the contour lines.
Highlight contours
This option requests that contours at the specified frequency (e.g. every third contour line) are plotted with a different pen. The attributes of this pen (e.g. colour and thickness) can be used to make the highlight stand out clearly in the display.
Display contour labels
This option requests that contours at the specified frequency include a label which can be either the actual Heights or an Ordinal value representing the order of the contour heights.
Contour levels
Specifies how the contour heights are to be drawn. You can enter a list of contour heights (separated by spaces or commas) using the Contour heights option. Alternatively, you can select Interval between contours to specify an interval between each contour or Number of contours to define the exact number of contour lines required.
Display contour fill
Enables or disables colour fill of the plot. You can modify he base colour of the contour fill using one of the options.
The Intensity option provides a list of colours which can be used to fill the contours. You can reduce the range of intensity by specifying the lower and upper percentage points in the spaces provided. A sample of the intensity of colours that will be used is displayed to the right of the option. The Spectrum specifies the shades to be defined in increasing intensities between the two selected colours. A sample of the intensities is displayed. If a plot is drawn using discrete colours the Discrete colours option can be used to change these colours.