Sometimes there may be comparisons between the levels of a treatment factor that you are particularly keen to assess. In this case you can test the significance of these individual comparisons using contrasts.
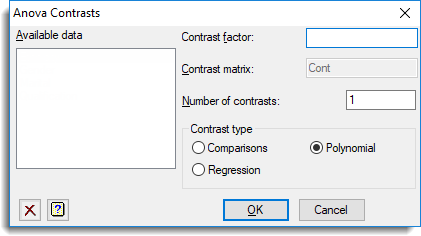
- The dialogs shown below are opened from the Analysis of Variance dialog by clicking the Contrasts button.
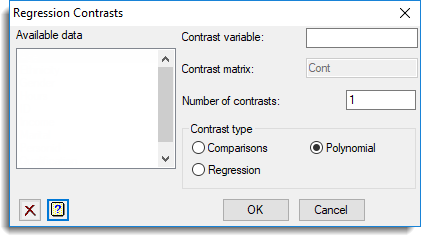
Within the ANOVA table, the sums of squares and significance of these comparisons will be printed for each factor. This dialog lets you specify these contrasts for any treatment factor involved in the ANOVA. For Comparisons or Regression type contrasts, a matrix spreadsheet is created, and must be filled in as described below to define these contrasts.
 |
 |
| Anova contrasts | Regression contrasts |
Example
The ANOVA Contrasts Example illustrates the use of contrasts in ANOVA and provides further discussion of some of the issues involved.
Available data
This lists the factors that can be used for contrasts. Double clicking one of these will move the name to the Contrast factor field.
Contrast factor
Specifies the factor for which the contrasts are to be applied in the ANOVA.
Contrast matrix
This specifies the name of a matrix containing the contrasts to be applied in the ANOVA when the selected contrast type is either Regression or Comparisons. Each row in the matrix represents a separate contrast, and the columns in the matrix correspond to the factor levels. The row labels in the matrix will be used to label the contrasts in the ANOVA table.
Contrasts have the property that the sum of the values making up the contrast should be zero. The simplest contrast is an individual difference between two levels of a factor and these would be given values -1 and 1. The following table gives common sets of contrasts in a 4 level factor. Any treatment level that is not involved in the contrast is given a value of 0.
| Factor level | Contrast Type | |||
| A | B | C | D | |
| -1 | 1 | 0 | 0 | Difference between A and B |
| 0 | 0 | -1 | 1 | Difference between C and D |
| -1 | -1 | 1 | 1 | Difference between average of A and B and that of C and D |
| -2 | 1 | 1 | 0 | Difference between A and the average of B & C |
| -3 | 1 | 1 | 1 | Difference between A and the average of B,C and D |
| -3 | -1 | 1 | 3 | Linear trend across A, B, C and D |
Number of contrasts
Specifies the number of contrasts to be made for the factor. For a polynomial, 1 = Linear, 2 = Quadratic, 3 = Cubic, etc. This should be no more than the number of factor levels – 1 (i.e. the maximum number of degrees of freedom available to that factor).
Contrast type
| Comparisons | Differences between a combination of treatment means. The differences to be tested are provided in a contrast matrix |
| Polynomial | The linear, quadratic, and higher-order terms from orthogonal polynomials fitted using the X values from the levels of the factor, or 1,2,3… by default if the factor only has labels or ordinal values defined |
| Regression | The treatment means regressed against the contrast values. The contrasts to be tested are provided in a contrast matrix, and are orthogonalized so that they are all statistically independent. A warning is given if the original set of contrasts was not orthogonal. (Two contrasts ai‘ and aj‘ are orthogonal if the sum of the products of their terms is zero, i.e. ai‘aj=0) |
OK
Creates a spreadsheet menu for the contrast matrix if it does not exist, and inserts the contrast formula into the Treatment structure field.