Use this to set additional options for the control charts.
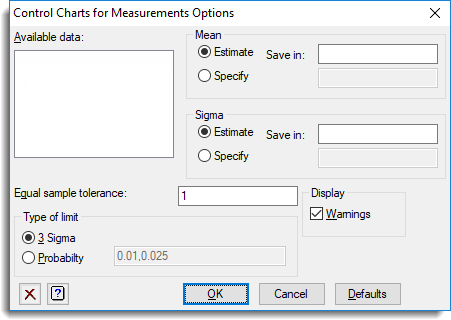
Available data
List scalars that can be used to supply the data. Double-click a name to copy it into the current input field or type the name.
Mean
Controls whether the process mean is supplied (either as target of from previous observations) or calculated from the data values. Select Estimate to calculate the mean from the data values. You can specify a name of scalar in the space provided to save the mean. Alternatively, select Specify to supply the process mean, entering the value in the space provided.
Sigma
Controls whether the sigma is supplied (either as target of from previous observations) or calculated from the data values. Select Estimate to calculate sigma from the data values. You can specify a name of scalar in the space provided to save sigma. Alternatively, select Specify to supply the sigma, entering the value in the space provided.
Equal sample tolerance
Specifies a multiplier to use to test whether to use mean sample size for control limits.
Display
Specifies the output to be displayed.
| Warnings | Lists any exceedance of the control limits. |
Type of limit
Specifies the type of control limit to be used. Select 3 Sigma for the traditional chart setting the centre line at the mean, and the control limits at 3*SIGMA and -3*SIGMA from the mean. Alternatively, select Probability to set control limits according to probability values. You can set the probability values to define the limits in the space provided. Note you can specify no more than two values for the probabilities.
Weight
Specifies the weight parameter used in the calculation of the exponentially weighted moving-average statistic.
No. standard deviations for limits
For the exponentially weighted moving-average chart this specifies the number of multiples of sigma to use for the control limits.