Use this to display results from a Canonical Variates, Discriminant or Stepwise Discriminant analysis in a 2d-Trellis plot for groups. The title of the menu will depend upon the menu that called the dialog.
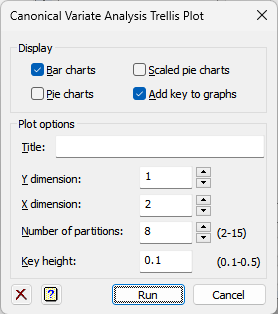
Display
This selects the type of plot to be displayed, and whether to include a key in the graphs. All three plot types can be displayed at once, but at least one must be selected.
| Bar charts | Displays bar charts with a bar for each group. |
| Pie charts | Displays pie charts with a segment for each group that is present in the corresponding panel of the trellis. The number of observations in each pie chart will be displayed in a label in the top left of the panel. |
| Scaled pie charts | Displays scaled pie-charts with a segment for each group that is present in the corresponding panel of the trellis. The area of each pie chart is proportional to the number of observations in the panel. |
| Add key to graphs | Adds a key below the Trellis plot displaying the group names and colours. |
Title
This gives the title for the graph. If you want this blank, enter a space in the field to stop the automatic title.
Y dimension
The dimension to be plotted on the y-axis.
X dimension
The dimension to be plotted on the x-axis.
Number of partitions
The number of partitions of the y and x-axes (which must between 2 and 15).
Key height
The height of the key (which must be between 0.1 and 0.5).
Action Icons
| Clear | Clear all fields and list boxes. | |
| Help | Open the Help topic for this dialog. |