Select menu: Stats | Time Series | Data Exploration
Displays time series statistics useful for ARIMA model selection. Produces numerical summaries and graphical output.
- After you have imported your data, from the menu select
Stats | Time Series | Data Exploration. - Fill in the fields as required then click Run.
You can set additional Options then after running, save the results by clicking Save.
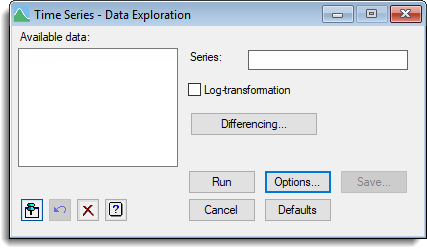
Available data
This lists variates that can be analysed as the Series parameter. Double-click a name to copy it to the current input field or type the name.
Series
Specifies a variate containing the time series data.
Log-transformation
Selects whether to perform the analysis on a log-transformed scale.
Action Icons
| Pin | Controls whether to keep the dialog open when you click Run. When the pin is down |
|
| Restore | Restore names into edit fields and default settings. | |
| Clear | Clear all fields and list boxes. | |
| Help | Open the Help topic for this dialog. |
See also
- Options for selecting what output to print or plot.
- Differencing for removing trend or seasonal variation.
- Save for saving correlations in data structures.