Restricting a spreadsheet lets you narrow down the displayed data so you only view the information you need. When data are restricted in a spreadsheet the rows that are excluded by the restriction (the hidden rows) are ignored by the Genstat server; rows included in the restriction are displayed. Excluded rows will be not be included in any subsequent analysis, thus providing a way of analysing a subset of data without having to make a copy of the spreadsheet containing just the required rows.
Restrictions can be applied to matrices and tables within a spreadsheet, however, these structures cannot be restricted within the Genstat server. Restricting these structures is useful for display purposes and for putting subsets of the rows into a Word table or Excel file.
There are some analyses which do not work with restrictions, and these require a physical subset of data to be created. You can do this using Subset on Update. If the Spread | Restrict/Filter | Subset on Update option is selected, a reduced matrix or table with restricted rows removed will be sent to the server, otherwise the restrictions within the spreadsheet will be used for display purposes only and the full data will always be updated to the server.
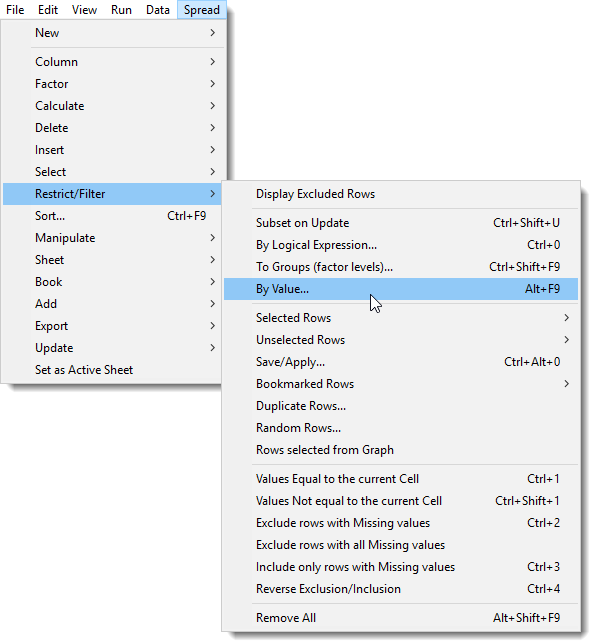
The menu above, accessed by selecting Spread | Restrict/Filter contains many pre-defined filters. You can also build your own filters and save them to be reused again.
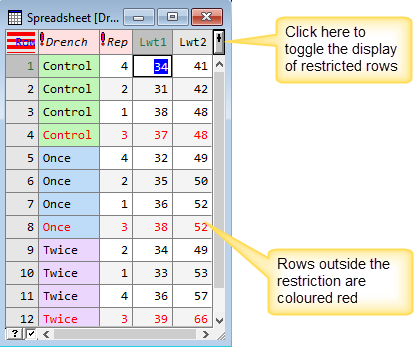
When a spreadsheet has a restriction applied the first cell will contain red stripes as a visual indicator of the restriction. Values that are excluded from the restriction will display in red by default, but you can change the colour if required (see Setting the Default Colour of Restricted Rows).
Rows that are excluded from a restriction are hidden, but not removed. You can toggle the display of restricted rows by clicking the + button in the top-right corner of the spreadsheet.