Select menu: Stats | Distributions | Extremes | Observations above Threshold
Fit a Generalized Pareto distribution to the observations in a variate above a given threshold.
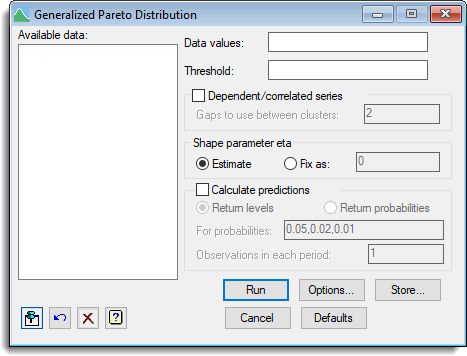
- After you have imported your data, from the menu select
Stats | Distributions | Extremes | Observations above Threshold. - Fill in the fields as required then click Run.
You can set additional Options before running the analysis and save the results by clicking Store.
This analysis is used to estimate the return periods and levels for extreme events where every observation in the series has been measured. Only the tail of the full distribution is modelled, and the tail is defined by the use of a threshold. Data above the threshold is used in the analysis, and the rest of the data is ignored. Asymptotically, as the threshold is increased, the Generalized Pareto distribution should converge to the actual tail distribution if the actual distribution of the data is maximum-stable.
Where only the maxima of groups of observations have been recorded, use the Fit a Generalized Extreme Value Distribution menu.
See GPARETO procedure for further details about the model, assumptions and graphs produced by this analysis.
Available data
This lists data structures appropriate to the current input field. The contents will change as you move from one field to the next. You can double-click a name to copy it to the current input field or type it in.
Data values
The variate containing the values whose tail distribution is to be modelled using a Generalized Pareto distribution.
Threshold
A variate or scalar, X, whose values provide the threshold used for exceedances. The distribution of values above this threshold will be modelled as a Generalized Pareto distribution.
This can be a single value (scalar) so that the same threshold is used for all the data, or may be a variate so that the observations above a varying limit is modelled. For example with a series of temperatures over a year, the threshold may be a periodic curve giving the expected value of a quantile over the year.
If you are not certain of the threshold to use, a missing value, *, can be entered, in which case the analysis will produce the Mean Residual life and Stability plots for sigma and eta to help you in your selection of the threshold.
Dependent/correlated series
When the series you are modelling has positive auto-correlation or dependencies between adjacent elements, then this can bias the estimates of return values or probabilities. When this occurs, the values above the threshold will tend to occur in clusters. This bias can be overcome by replacing clusters of values above the threshold with a single value, the maximum of the cluster.
The clusters are defined using the Gaps to use between clusters parameter. Units above the threshold are grouped together into a single cluster, until the gap between values above the threshold exceeds the gap size specified. For example, the series: 7, 9, 1, 9, 5, 2, 7, 8, 7, 4, 3 using a threshold of 6, has the status of being above the threshold of: 1,1,0,1,0,0,1,1,1,0,0 and the clusters above the threshold would be (7,9), (9), (7,8,7) with a gap size of 1, giving the series 9,9,7 when the maximum of the clusters is taken. If a gap size of >2 was used, the first two clusters would coalesce to give clusters (7,9,9) as the gap between the two 9s is only one unit (< 2), giving the series 9,8 when the maxima are taken.
The value Theta is printed by the analysis, and is the reciprocal of the mean cluster size. A value of theta close to 1 indicates all observations over the threshold occur in isolation, and a small value of theta indicates that the observations exceeding the threshold are strongly clustered together.
Shape parameter eta
For the shape parameter used in the model, there is a choice of:
| Estimate | Maximum likelihood estimation is used to obtain the value of eta which gives the best fit of the data to the model |
| Fix as | Lets you specify a value of eta in the space provided to fix the value of eta used in the model. Setting eta to 0 will force the Gumbel distribution to be fitted |
Another use of fixing eta, would be to fit a model to groups, so that both the location and scale parameters could vary. Restricting the observations to a particular group, and then fitting the model with a given value of eta allows for this. By doing this for each group, and then adding up the log-likelihoods and comparing this with an overall model with common scale parameter, the assumption of a common scale parameter can be tested.
Calculate predictions
When selected, the analysis will calculate predicted values and confidence limits for the specified values. The choice of predicting either Return levels or Return probabilities is provided for.
Return levels – You provide a return probability and a return level which occurs at this rate in the data is calculated (e.g. 5% = 1/20 so the predicted return level would occur once in every 20 maxima).
Return probabilities – You provide a return level and the probability that a random observation would exceed this value is calculated.
The Observations in each period value is used to specify that you would like return periods measured on a different scale to the individual units in your series. Thus if you had daily data, and wanted a 1 in 20 year occurrence, you would enter a value of 365 in this edit box to specify that you wanted 365 days grouped together to form the units that the repeats are measured on.
Action buttons
| Run | Run the analysis. |
| Cancel | Close the dialog without further changes. |
| Options | Opens a dialog where additional options and settings can be specified for the analysis. |
| Defaults | Reset the dialog to the default settings. Clicking the right mouse on this button produces a shortcut menu where you can choose to set the options using the currently stored defaults or the Genstat default settings. |
| Store | Opens a dialog to specify names of structures to store the results from the analysis. The names to save the structures should be supplied before running the analysis. |
Action Icons
| Pin | Controls whether to keep the dialog open when you click Run. When the pin is down |
|
| Restore | Restore names into edit fields and default settings. | |
| Clear | Clear all fields and list boxes. | |
| Help | Open the Help topic for this dialog. |
See also
- Generalized Pareto Distribution Options
- Generalized Pareto Distribution Store Options
- Fit a Generalized Extreme Value Distribution menu for the analysis of maximum values.
- GPARETO procedure
- GRGPARETO procedure for generating random GPARETO deviates