Select menu: Stats | Distributions | Extremes | Maxima
Use this to fit a Generalized Extreme Value (GEV) distribution to the values in a variate.
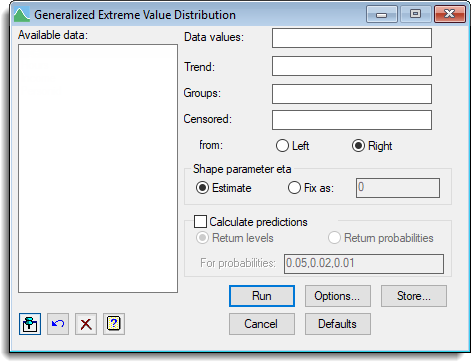
- After you have imported your data, from the menu select
Stats | Distributions | Extremes | Maxima. - Fill in the fields as required then click Run.
You can set additional Options before running the analysis and save the results by clicking Store.
This analysis is used to estimate the return periods and levels for extreme events, where the maximum of fixed number of observations is recorded (for example, yearly maxima). Asymptotically, as the number of observations used in each maximum is increased, actual distribution of the maxima should converge to the GEV distribution, if the actual distribution of the data is maximum-stable. Where every observation in the series has been measured, rather than just the maximum values, use the Fit a Generalized Pareto Distribution menu.
See GEV for further details of the model, assumptions and graphs produced by this analysis.
The analysis can also optionally allow for both differences in the location parameter between groups, and a linear trend in the maxima associated with another variate.
The analysis can allow for censored data (where the true value is not known, but an upper or lower limit for the true value is known). Censored data can arise from equipment failure (e.g. a rain gauge overflows, or a reading goes off the scale of the measuring device), or where incomplete data is recorded, so that the true maximum may not have been observed (e.g. data not observed due to the observer being off work for part of a period).
The Data | Probability Calculations menu includes the Gumbel and GEV distributions and can be used to calculate probabilities for these distributions.
Available data
This lists data structures appropriate to the current input field. The contents will change as you move from one field to the next. You can double-click a name to copy it to the current input field or type it in.
Data values
The variate containing the values whose distribution is to be modelled using a Generalized Extreme Value distribution.
Trend
A variate, X, whose values will be fitted to a linear regression model for the location parameter, mu, so that mu = Intercept + Slope*X.
Groups
A factor containing up to 12 groups that will have separate location parameters, mu(i), fitted for each group. The location parameters for the groups are parameterised as a location parameter for group 1, and then a difference between subsequent groups and group 1, i.e. mu(1) and then mu(2) – mu(1), mu(3) – mu(1), etc.
Censored
A variate containing indicator values for the units that are censored. Censored units are marked with a 1, with a zero given otherwise. A censored unit is one in which the exact value is not measured, but you only know the true value is at least the value given in the Data variate (Right censored) or at most the value given (Left censored).
The direction of censoring can be selected as either:
| Right | true value >= X |
| Left | true value <= X |
Shape parameter eta
For the shape parameter used in the model, there is a choice of:
| Estimate | Where maximum likelihood estimation is used to obtain the value of eta which gives the best fit of the data to the model |
| Fix as | Lets you specify value for eta in the space provided, to fix the value of eta used in the model. Setting eta to 0 will force the Gumbel distribution to be fitted |
Another use of fixing eta, would be to fit a model to groups, so that both the location and scale parameters could vary. Restricting the observations to a particular group, and then fitting the model with a given value of eta allows for this. By doing this for each group, and then adding up the log-likelihoods and comparing this with an overall model with common scale parameter, the assumption of a common scale parameter can be tested.
Calculate predictions
When selected, the analysis will calculate predicted values and confidence limits for the specified values. The choice of predicting either Return levels or Return probabilities is provided.
Return levels – You provide a return probability and a return level which occurs at this rate in the data is calculated (e.g. 5% = 1/20 so the predicted return level would occur once in every 20 maxima).
Return probabilities – You provide a return level and the probability that a random observation would exceed this value is calculated.
Action buttons
| Run | Run the analysis. |
| Cancel | Close the dialog without further changes. |
| Options | Opens a dialog where additional options and settings can be specified for the analysis. |
| Defaults | Reset the dialog to the default settings. Clicking the right mouse on this button produces a pop-up menu where you can choose to set the options using the currently stored defaults or the Genstat default settings. |
| Store | Opens a dialog to specify names of structures to store the results from the analysis. The names to save the structures should be supplied before running the analysis. |
Action Icons
| Pin | Controls whether to keep the dialog open when you click Run. When the pin is down |
|
| Restore | Restore names into edit fields and default settings. | |
| Clear | Clear all fields and list boxes. | |
| Help | Open the Help topic for this dialog. |
See also
- Generalized Extreme Value Distribution Options
- Generalized Extreme Value Distribution Store Options
- Fit a Generalized Pareto Distribution for the analysis of the complete series of values.
- Probability Distribution Calculations
- GEV procedure
- GRGEV procedure for generating random GEV deviates