Select menu: Data | Probability Calculations
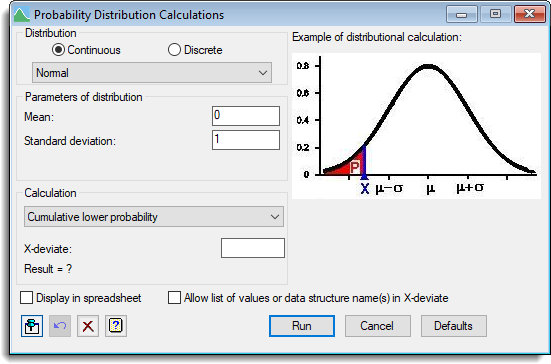
This dialog provides probability calculations for a range of discrete and continuous probability distributions. This allows many of the calculations that are looked up in Statistical tables to be quickly computed.
A simple diagram is provided for each calculation type to illustrate what is being calculated. The input value is displayed in blue and the resulting calculated value in red. The curves shown for continuous distributions are the probability density function, and for discrete distributions the bars represent the individual probability values at a given deviate. The actual curve/histogram displayed is indicative only, and may not match the actual shape of the selected distribution.
These calculations can be conducted with more generality with the Calculations menu.
- After you have imported your data, from the menu select Data | Probability Calculations.
Distributions
Specifies the distribution to be used for the calculations. Following the usual convention, these are divided into two categories:
| Continuous | A range of continuous distributions |
| Discrete | A range of discrete distributions can be selected from the dropdown list |
The linear correlation coefficient (r) is the distribution of the correlation coefficient of X and Y under the assumption that they are independent and both normally distributed. For N observations, the linear correlation coefficient has N-2 degrees of freedom. Note a partial correlation coefficient can be tested for significance using this distribution, but with degrees of freedom N-2-V, where V is the number of variables held constant.
Further details of other distributions available here are given in the Syntax and Data Management Guide on pages 204-209.
The Gamma and Weibull distributions have been extended to allow the minimum value of x to be a user specified constant rather than zero. The Gamma pdf of the extended distribution is given as:
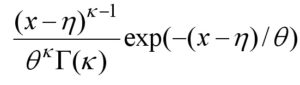
and the extended Weibull pdf is
![]()
Parameters
These fields specify the parameters for the selected distribution.
Calculation type
Lists the different types of calculation that are available for the chosen distribution. Note the term ‘deviate’ indicates the value on the x axis which is being calculated, as opposed to a probability value. Not all calculation types are available for all distributions.
| Cumulative lower probability | The cumulative probability below the given deviate. |
| Cumulative upper probability | The cumulative probability above the given deviate. |
| Equivalent deviate | The deviate for which the cumulative probability below it is equal to the given probability. |
| Deviates excluding probability | The pair of deviates for which the probability outside the interval is equal to the given probability. These are placed so that half the excluded probability is above and below the interval. |
| Deviates containing probability | The pair of deviates for which the probability inside the interval is equal to the given probability. These are placed so that half of the complementary probability (1-p) is above and below the interval. |
| Confidence limits of mean | This gives the confidence limits for a mean so that on resampling, the true mean would be contained in this interval with a given probability. |
| Critical value (one-sided) | This gives the deviate for which the standardized deviate would only exceed with the given probability. |
| Critical value (two-sided) | This gives the deviates for which the absolute standardized deviate would only exceed with the given probability, or for non-symmetrical distributions, the pair of deviates defining an interval. |
| Probability in interval | The cumulative probability between the given lower and upper deviates. |
| Probability outside interval | The cumulative probability outside the given lower and upper deviates. |
| Probability density | The value of the probability density at a given deviate. This is only defined for continuous distributions. |
| Individual probability | The individual probability at a particular deviate. This may only be calculated for a discrete distribution. |
Input value
This is the given value for the specified calculation, labelled appropriately for each calculation. Note that when providing a probability, you can provide either a proportion between 0 and 1 or a percentage between 1% and 100%. If you provide a percentage less than 1 this will be interpreted as a proportion, so you cannot use % less than 1.
When entering deviates, discrete distributions must only use 0,1,2… and some continuous distributions require only positive values.
Display in spreadsheet
If this item is selected, the results from the calculation, along with the input to the calculation will be displayed in a new spreadsheet. Note that if you have the option selected you will be warned if you create multiple spreadsheets, without closing the previous ones.
Allow list of values or data structure names
If you select this option, multiple numbers (a list in either space or comma delimited format, a progression (e.g. 0…5 for 0,1,2,3,4,5)) may be provided, or a variate name (e.g. X) may be typed into the input value. This is not available for all calculations.
When this option is active, the size of the input value field is extended to allow for space for typing, but all validation of the input values is suppressed.
Action buttons
| Run | Run the probability calculation. |
| Cancel | Close the dialog without further changes. |
| Defaults | Reset options to the default settings. Clicking the right mouse on this button produces a pop-up menu where you can choose to set the options using the currently stored defaults or the Genstat default settings. |
Action Icons
| Pin | Controls whether to keep the dialog open when you click Run. When the pin is down |
|
| Restore | Restore names into edit fields and default settings. | |
| Clear | Clear all fields and list boxes. | |
| Help | Open the Help topic for this dialog. |
See also
- Fit Distribution menu
- Further details of distributions
- Calculations menu
- CALCULATE directive
- Empirical Distribution Tests
- EDFTEST procedure
- DPROBABILITY procedure