Selects information to be displayed and graphs to be plotted after a generalized Pareto distribution has been fitted and controls the type and display of confidence limits.
Note that using profile likelihood confidence limits can be very slow.
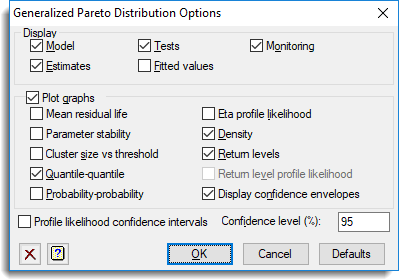
Display
This specifies which items of output are to be produced by the analysis.
| Model | The formula of the cumulative distribution function for the fitted distribution |
| Estimates | Parameter estimates of distribution fitted by the analysis |
| Tests | Goodness of fit tests for the fitted distribution and likelihood ratio tests of the shape parameter (eta) |
| Fitted values | Produces a table of Observed values from the data and Estimated values from the fitted model |
| Monitoring | A trace of the log-likelihood and parameters while the optimal values are found |
Plot graphs
This specifies which graphs are to be plotted after the analysis. If this is not selected, no graphs will be produced.
| Mean residual life | A plot of the mean residual life against the possible thresholds in the data |
| Parameter stability | A plot of the estimated parameters (eta and sigma) against a range of values of the threshold (all those within the data range) |
| Cluster size vs threshold | A plot of theta, the reciprocal of the mean cluster size, against a range of values of the threshold |
| Quantile-quantile | A plot of the sorted data values plotted against the estimated quantiles of the fitted distribution |
| Probability-probability | A plot of the observed return probabilities plotted against the expected return probabilities from the fitted distribution |
| Eta profile likelihood | A plot of the profile likelihood obtained by varying the shape parameter, eta, over a range of values, and maximising the log-likelihood over the other parameters for each value of eta. This will provide confidence limits for eta |
| Density | A combination plot of the observed data values along the x axis, a histogram of the observed values and the fitted probability density function scaled so that the area under the curve equals the area under the histogram |
| Return levels | A plot of the observed return levels plotted against the expected return period (i.e. 1 in n observations) from the fitted distribution |
| Return level profile likelihood | A plot of the profile likelihood obtained by varying the return level for the given return probability over a range of values, and maximising the log-likelihood over the other parameters for each value. This will give exact confidence limits for the return levels and is only given if the Exact confidence limits option is selected |
| Display confidence envelopes | This option puts approximate confidence envelopes/bands around fitted values on any applicable plot at the level specified in the Confidence Level (%) field. |
Profile likelihood confidence limits
When selected, the analysis will obtain confidence limits for return levels by forming a profile likelihood over a range of values for the return period. Using exact confidence limits can be very slow, but are more accurate.
When not selected, then approximate quadratic limits will be formed. These are symmetric limits based on the Hessian of the log-likelihood at the maximum-likelihood estimates.
Confidence level (%)
The percentage value of the probability that the confidence limits will contain the true value. Default 95%.
Action buttons
| OK | Save the specified options and close the dialog. |
| Cancel | Close the dialog without making any changes to the options. |
| Defaults | Set the option settings back to the default settings. |
See also
- Fit a Generalized Pareto Distribution menu
- Generalized Pareto Distribution Store Options
- Fit a Generalized Extreme Value Distribution menu
- GPARETO procedure
- GRGPARETO procedure for generating random GPARETO deviates