Select the output and plots to be generated in a functional linear relationship analysis. The type of confidence interval (parametric or bootstrap) and details of the bootstrap used and some options of some of the models can also be set in this dialog.
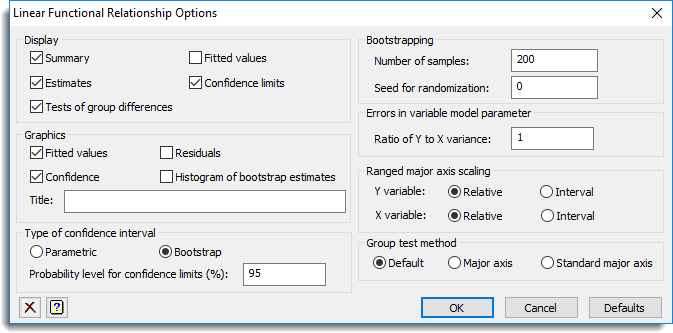
Display
| Summary | Summary of the fitted models |
| Fitted values | Table containing the fitted values and residuals of the response variate for each selected model. |
| Estimates | The estimates of slope and intercept for each model and group. |
| Confidence limits | The confidence limits of the estimates based on the chosen type of confidence interval. |
| Tests of group differences | The probability that groups have different slopes, elevations and locations. |
Graphics
| Fitted values | The fitted lines for each model selected with the observed data points. |
| Residuals | Diagnostic plots of the residuals. |
| Confidence | Add the confidence limits to the fitted value plot (only if bootstrapping is used). |
| Histogram of bootstrap estimates | A histogram of the bootstrap distribution for each parameter in the models |
The Title field lets you specify a title for the plots.
Type of confidence interval
The type of confidence limit Parametric (derived for normal theory) or Bootstrap (many samples obtained by resampling with replacement), and the Probability level for the confidence limits (as percentage between 0 and 100) can be set here.
Bootstrapping
The number of bootstrap samples and a seed to initial the random number generator can be set here. A seed of 0 uses the computers clock to initialize the random number generator.
Errors in variable model parameter
The Ratio of Y to X variance parameter controls the ratio of the two variances (i.e. Var(Y)/Var(X)). A ratio close to 0 will give a result like a X on Y regression (i.e. assumes Y is exactly known), a large value will give a result like the Y on X regression (i.e. assumes X is exactly known as in ordinary linear regression) and a ratio of 1 will give the major axis result.
Ranged major axis scaling
For each of the Y and X variables, this controls the scaling of that variable. The Relative setting scales the variable by its maximum, while the Interval setting uses its range. With the Relative setting, the values of the variable should all be positive.
Group test method
The model used in estimating the testing of differences between groups.
| Default | Use the method most closely related with the selected model to estimate the probabilities of differences between groups |
| Major axis | Use the major axis model to estimate the probabilities of differences between groups |
| Standard major axis | Use the standard major axis model to estimate the probabilities of differences between groups |