Use this to specify the save options for a general survey analysis.
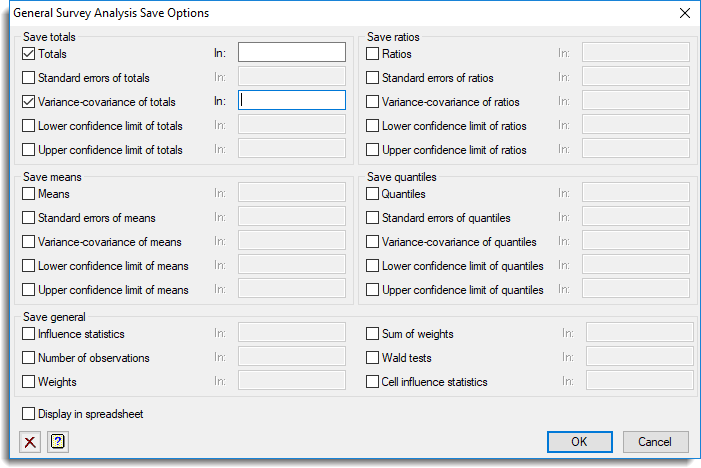
Save
After selecting the appropriate boxes, type names for the data structures into the corresponding In: fields. The table below indicates the type of structures formed for each item.
| Totals | Scalar or Table | Estimates of the stratum totals. |
| Standard error of totals | Scalar or Table | Standard error of the stratum totals. |
| Variance-covariance of totals | Symmetric matrix | The variance-covariance matrix of total estimates. |
| Lower confidence limits of totals | Scalar or Table | Lower confidence limits of totals. |
| Upper confidence limits of totals | Scalar or Table | Upper confidence limits of totals. |
| Means | Scalar or Table | The estimates of the stratum means. |
| Standard error of means | Scalar or Table | The standard error of the stratum means. |
| Variance-covariance of means | Symmetric matrix | The variance-covariance matrix of mean estimates. |
| Lower confidence limits of means | Scalar or Table | Lower confidence limits of means. |
| Upper confidence limits of means | Scalar or Table | Upper confidence limits of means. |
| Ratios | Table | The estimates of the ratios by stratum (ratio estimation only). |
| Standard error of ratios | Table | The standard error of estimates of the ratios by stratum (ratio estimation only). |
| Variance-covariance of ratios | Symmetric matrix | The variance-covariance matrix of ratio estimates (ratio estimation only). |
| Lower confidence limits of ratios | Scalar or Table | Lower confidence limits of ratios (ratio estimation only). |
| Upper confidence limits of ratios | Scalar or Table | Upper confidence limits of ratios (ratio estimation only). |
| Quantiles | Table | The estimates of the ratios by stratum (ratio estimation only). |
| Standard error of quantiles | Table | The standard error of estimates of the quantiles by stratum. |
| Variance-covariance of quantiles | Symmetric matrix | The variance-covariance matrix of quantile estimates. |
| Lower confidence limits of quantiles | Scalar or Table | Lower confidence limits of quantiles. |
| Upper confidence limits of quantiles | Scalar or Table | Upper confidence limits of quantiles. |
| Influence statistics | Variate | The influence statistics. |
| Number of observations | Table | The numbers of (non-missing) observations. |
| Weights | Variate | The weights. |
| Sum of weights | Table or Scalar | The sum of the weights. |
| Wald tests | Variate | The Wald statistics comparing means between the different levels of the classification factors. |
| Cell influence statistics | Variate | The influence statistics for the individual cells in the tables of results. |
Display in spreadsheet
Select this to display the results in a new spreadsheet window.