Use this to set various options related to a general survey analysis.
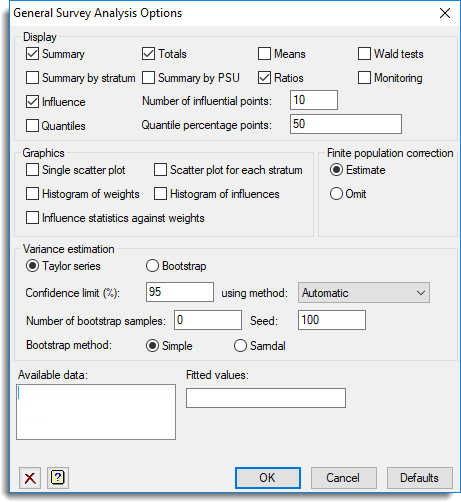
Display
Specifies the output to be displayed.
| Summary | Summary of analysis. |
| Totals | Tables of estimated totals and standard errors. |
| Means | Tables of estimated means and standard errors. |
| Wald tests | The Wald statistics comparing means between the different levels of the classification factors. |
| Summary by stratum | Summary by stratum. |
| Summary by PSU | Summary by PSU. |
| Ratios | Tables of estimated ratios and standard errors (ratio estimation only). |
| Monitoring | The progress of the bootstrap sampling is output. |
| Influence | List of influential points. Enter the Number of influential points to print in the space provided. |
| Quantiles | Quantiles for each stratum. Enter the Quantile percentage points in the space provided. This can be a list of numbers between 0 and 100, separated by spaces or commas. |
Graphics
Specifies the graphs to be displayed.
| Single scatter plot | Scatter plot of the response data against X or the stratum number if there is no ratio estimation. |
| Scatter plot for each stratum | Separate scatter plots for each stratum . |
| Histogram of weights | Histogram of the weights. |
| Histogram of influence | Histogram of the influence statistics. |
| Influence statistics against weights | Cell influence statistics plotted against the weights. |
Finite population correction
Specifies whether to Estimate or Omit finite population correction. This is usually omitted when a simplified variance estimate is produced for multistage samples by ignoring the within-cluster component of variation; since this is non-conservative the omission of this correction is sometimes used to counteract this and to ensure that standard errors are appropriate.
Variance estimation
This controls the method used to estimate the variances:
| Taylor series | Use a Taylor series approximation which is faster but less accurate |
| Bootstrap | Use bootstrap resampling which takes more time |
Confidence limit
This gives the method for forming confidence intervals. The % field specifies the probability level for the confidence intervals. The using method options are:
| Automatic | uses the percentile method when at least 400 bootstrap samples have been used, otherwise it uses the t-distribution method |
| t-distribution | calculates a standard error from the bootstrapped estimates and then uses the t-distribution to form intervals |
| Percentile | uses simple percentiles of the bootstrapped distribution |
Number of bootstrap samples
Number of times to resample the data in forming the bootstrap distribution of the statistics.
Seed
Specifies the seed for the random number generator used to make the permutations; default 0 continues from the previous generation or (if none) initializes the seed automatically from the clock.
Bootstrap method
In a one-stage design the use of the setting Simple forms each bootstrap sample by sampling with replacement from the original sample within each stratum. In a two-stage design, primary sampling units are first sampled with replacement, and then secondary units are sampled with replacement within the selected primary units. Variance estimates from the bootstrapping process will be biased where there are very few sampling units in each stratum and so the method is not recommended in this situation. The setting Sarndal constructs a “pseudo-population” by replicating each sampled unit by the rounded value of its weight, so that, for example, an observation with weight 16.1 is represented sixteen times in the pseudo-population (see SVTABULATE for details). The bootstrap sample is formed by sampling with replacement from this pseudo-population.
Fitted values
A variate containing fitted values. This can be used when estimating population totals via a model-assisted approach. Variance estimates are then calculated using the residual deviation about the fitted values. This can be used in conjunction with the Survey Calibration Weighting menu to provide estimates following calibration weighting. Double clicking items in the Available data will put them into this field.