Select menu: Stats | QTLs (linkage/Association) | Data Exploration | Genotypic Data | Display Genetic Map
Use this to plot a genetic map of marker positions for all or a subset of linkage groups (or chromosomes). The marker names can be viewed on the resulting graph in the graphics viewer using the data info tool.
- From the menu select
Stats | QTLs (linkage/Association) | Data Exploration | Genotypic Data | Display Genetic Map. - Fill in the fields as required then click Run.
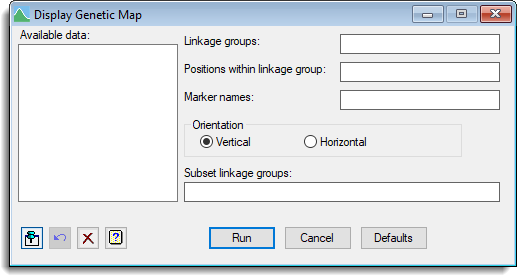
Available data
This lists data structures appropriate to the current input field. Double-click a name to copy it to the current input field or type the name. If data has been stored in a QTL data space then only the data structures present within that data space will be displayed in the Available data, otherwise all the current data within Genstat will be displayed. When data are present within the QTL data space you can right-click on the Available data list to open a shortcut menu where you can change between displaying data only within the data space and all data within Genstat.
Linkage groups
A factor defining the different linkage groups (or chromosomes).
Positions within linkage group
A variate specifying the positions of the markers within the linkage groups.
Marker names
A text specifying the names of each of the markers. If supplied, the marker names can be viewed on the resulting graph in the graphics viewer using the data info tool.
Orientation
Specifies whether the genetic map is to be drawn vertically or horizontally.
Subset linkage groups
This option can be used to display a subset of the linkage groups. This can be set to variate or a scalar of the group number(s) defining a subset of the levels of the linkage groups factor. If the linkage groups factor contains labels then a text defining a subset of its labels can be supplied. Alternatively, a comma separated list of group number(s) or labels can be supplied so specify the subset of linkage groups.
Action buttons
| Run | Plot the genetic map. |
| Cancel | Close the dialog without further changes. |
| Defaults | Reset options to the default settings. Clicking the right mouse on this button produces a shortcut menu where you can choose to set the options using the currently stored defaults or the Genstat default settings. |
Action Icons
| Pin | Controls whether to keep the dialog open when you click Run. When the pin is down |
|
| Restore | Restore names into edit fields and default settings. | |
| Clear | Clear all fields and list boxes. | |
| Help | Open the Help topic for this dialog. |
See also
- QTL data space for using data in QTL menus
- QTL analysis using menus
- DQMAP procedure in command mode