Use this to control plotting of lines and points within the graph.
- Double-click your graph then click the Graphs Options tab.
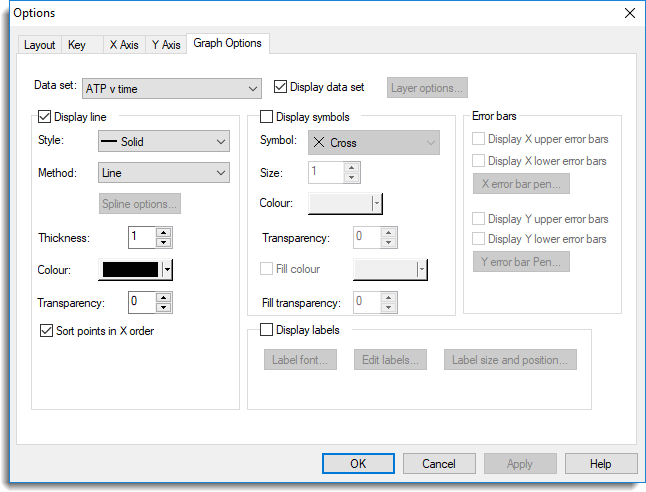
Data set
Specify the data set. You can choose between any of the data sets plotted within the currently active graph. The remaining fields on this menu will be updated to indicate the options currently selected for this data set, which you can then modify if required.
Layer options
Use this to specify the order in which data sets are plotted.
Display line
Controls whether a line is plotted through the points in the data set. If selected, you can control various attributes of the line using the options that follow.
Style
This specifies the style of line. You can choose between the following styles: Solid, Dot, Dash, Dot dash, Tight dash, Long dash, Short dash, Close dot, Fine dot and Double dot dash.
Method
Specifies the method used for drawing the line.
| Line | Join the points using straight line segments. |
| Monotonic | Fits a smooth curve to the points in ascending X order; it is generally suited to plotting curves of continuous functions. |
| Closed curve Open curve |
Fit smooth curves which do not require sorting of the points. Can be used to plot any general curved line. |
| Spline | Plots a smoothing spline fitted through the points. |
| Fill | Selects polygon fill where the points are joined by straight lines and the enclosed space filled with colour; the last point is joined to the first to ensure closure of the polygon. |
Spline options
By default four degrees of freedom are used in the spline, however, you can change this by supplying another value in the Spline Options dialog. You can also specify how to treat missing values.
Thickness
Specifies the thickness of the plotted line. You can use the up and down arrows to cycle through integer values in the range 1 to 5. Other values, including fractional values, can be typed in directly.
Colour
Sets the colour used for plotting the line.
Transparency
Sets the transparency used for plotting the line. You can use the up and down arrows to cycle through integer values in the range 0 (opaque) to 255 (completely transparent).
Sort points in X order
If selected, the data will be sorted so the X values are in ascending order prior to plotting. This ensures correct appearance of fitted lines, for example, regardless of the order in which data are recorded or stored. On the other hand, some lines may need to be plotted in the order in which the values are given, for example when drawing the outline of a polygon.
This option is not applicable to 3D Graphs; it is assumed the data are ordered correctly.
Display symbols
Controls whether symbols are plotted at each point. If selected, you can control various attributes of the symbols.
Symbol
Specifies the symbol to be used:Cross is the default symbol. User defined symbols are supplied in Genstat using the PEN command and cannot be manipulated interactively.
Size
Specifies a scaling factor to be used in the calculation of the symbol size. A value of 1.0 will produce symbols of standard size, whilst 2.0 will produce symbols twice that size, and 0.5 will produce symbols half the normal size. You can use the up and down arrows to cycle through integer values in the range 1 to 5. Other values, including fractional values, can be typed in directly.
Colour
Specifies the colour to be used for drawing the symbols.
Transparency
Sets the transparency used for drawing the symbols. You can use the up and down arrows to cycle through integer values in the range 0 (opaque) to 255 (completely transparent).
Fill colour
Some symbols can be drawn as hollow shapes or can be shaded. This option controls whether the symbols are filled in and lets you set a colour for the fill.
Fill transparency
Sets the transparency used for shading hollow symbols. You can use the up and down arrows to cycle through integer values in the range 0 (opaque) to 255 (completely transparent).
Error bars
Controls the display of error bars if present.
Display X upper error bars
Toggles the display of the upper section of horizontal error bars.
Display X lower error bars
Toggles the display of the lower section of horizontal error bars.
X error bar pen
Controls the appearance of the line used to draw horizontal error bars.
Display Y upper error bars
Toggles the display of the upper section of vertical error bars.
Display Y lower error bars
Toggles the display of the lower section of vertical error bars.
Y error bar pen
Controls the appearance of the line used to draw vertical error bars.
Display labels
Controls whether labels are plotted at the points. The labels can be specified in Genstat using the PEN command and cannot be manipulated interactively in this version.
Label font
Sets the font used to draw the labels.
Edit labels
Edit the label for each data point using the Edit Labels dialog.
Label size and position
This opens the Label Size and Position Options dialog that lets you specify a size multiplier and bounding box for the label.