You can reduce the number of columns displayed on screen by hiding selected columns. When columns are hidden the data from these will still be available in the Genstat server, and are saved when saving to a spreadsheet file. If a Genstat spreadsheet or workbook contains hidden columns these will be hidden on opening the file.
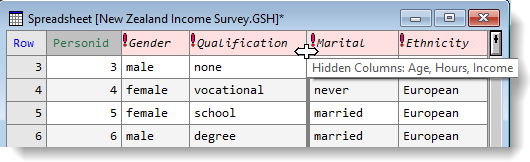
The columns on either side of any hidden columns have a thicker grid line between them, as shown in the following image. You can activate a tooltip to show which columns are hidden by hovering the cursor over the gap between the column headers.
You cannot hide classifying factors in tables, row labels in matrices or unit vectors in vector spreadsheets.
When copying, cutting or pasting from a spreadsheet, if the selection contains hidden columns you will be prompted to either include these hidden cells in a cut or copy, or whether to paste into these cells.
- Select Spread | Column | Hide/Show.
- Hold down the Ctrl key and click with the mouse to select multiple columns.
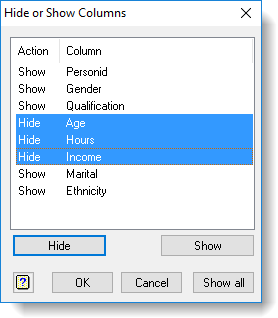
- Click the Hide or Show button as appropriate to perform that action then click OK when you’ve finished.
You can also re-display hidden columns by dragging with the mouse. The spreadsheet below contains three hidden columns, indicated by the thick grid line.
- To reveal the hidden columns, click to the right of the column gap then drag the cursor to the right (the distance doesn’t matter).
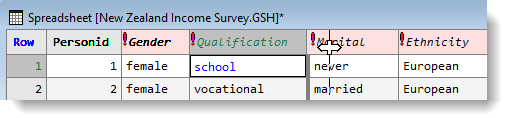
The hidden columns are now displayed.