This provides overall control for the histogram.
- Double-click your graph then click the Histogram Options tab.
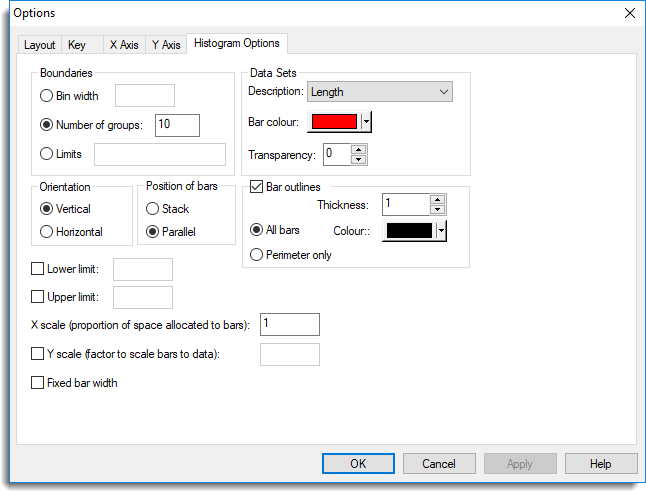
Boundaries
These options control how the data is formed into the groups displayed in the histogram. You can specify the Bin width or Number of groups. Alternatively you can specify the Limits, i.e. a set of values which define the separation into groups.
Data sets
This lets you set the colour and transparency (0 is opaque and 255 is completely transparent) of the histogram bars.
Orientation
The data scale is defined to be the X values, and the frequencies or bar heights the Y values. By default, histograms are plotted with vertical bars. This can be changed to horizontal if preferred. However, the group frequencies are still considered to be Y values and the data X values, even though they now appear horizontally and vertically, respectively.
Position of bars
For histograms of multiple data variates, the bars can be plotted in Parallel or Stacked.
Bar outlines
This lets you control the display of the bar outlines.
Lower limit
This can be used to specify a particular value for the lower limit of the first histogram bar. By default, this is determined by subtracting the width of the second bar from the first limit, unless the minimum data value is less, in which case that is used. A value greater than the minimum data value cannot be specified here.
Upper limit
This can be used to specify a particular value for the upper limit of the final histogram bar. By default, this is determined by adding the width of the penultimate bar to the last limit, unless the maximum data value is greater, in which case that is used. A value less than the maximum data value cannot be specified here.
X scale
This is a scaling factor applied in the X direction. Each bar is scaled to occupy the specified proportion of the allocated bar width.
For histograms of continuous data a value of 1.0 is recommended so that the histogram bars form a continuous display.
For parallel histograms of continuous data, a value less than 1.0 is recommended, to avoid confusion in the display.
Y scale
This option controls how the heights of the bars correspond to units of data. The height of each bar is calculated as (data-value * y-scale)/bar-width. By default, this value is set to the width of the narrowest bar. So for that bar, the height will correspond directly to the data units.
Fixed bar width
Usually, histograms of continuous data use the area of each bar to represent frequency. In other words, the bar heights are scaled according to the bar widths. Thus, if irregularly spaced limits are specified, the histogram will still accurately portray the distribution of the data. However, this option allows the bars to be of fixed-width which may be more appropriate in some circumstances.