This menu controls various options relating to the display of image plots.
- Double-click your graph then click the Image Options tab.
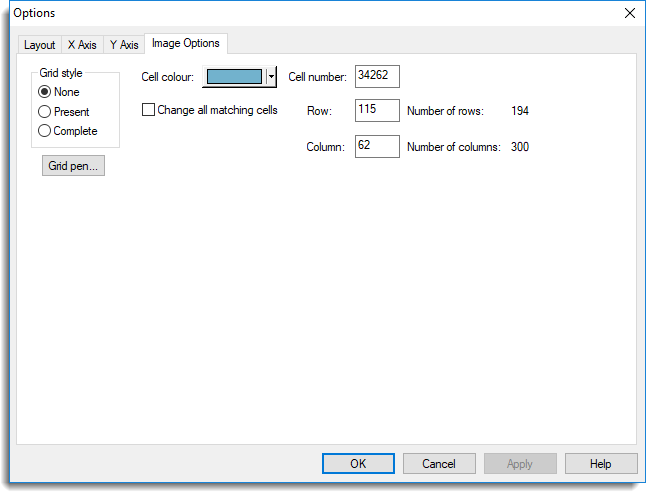
Grid style
Controls whether a grid is superimposed on the plot. For plots containing missing values you can choose whether to include or exclude grid lines around empty cells.
Grid pen
Lets you modify attributes of the grid lines.
Cell colour
Displays the colour of the current cell. You can choose a different colour to replace the original one.
Change all matching cells
If this option is selected then all cells matching the original colour of the current cell will change to the chosen colour.
Cell number, Row and Column
Displays the index, row number and column number of the current cell. You can change these to select a different cell as the current one.
Number of rows and Number of columns
Displays the number of rows and columns in the image.