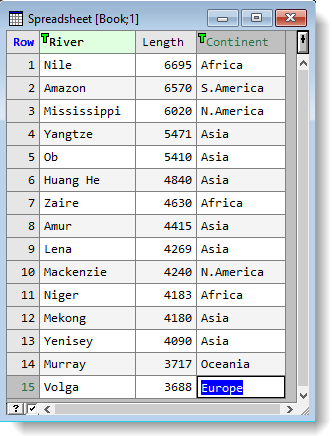
If you have a file of text in columns you can import this directly into Genstat and perform analyses on the data. It is not necessary to convert the data into a spreadsheet as Genstat will happily work with the data once it is loaded into the central data pool. However, converting to a spreadsheet gives you a visual display, and lets you easily manipulate cells, add bookmarks and filters, etc.

Genstat can import any single set of data that follows the following formatting rules:
- Data must be arranged in columns.
- There must be the same number of columns in each row so that the data forms a rectangle.
- The maximum number of characters in each row is 200.
- Values must be separated from each other by spaces or some other consistently used character such as a comma.
- The data may be preceded by a line giving the names of the columns.
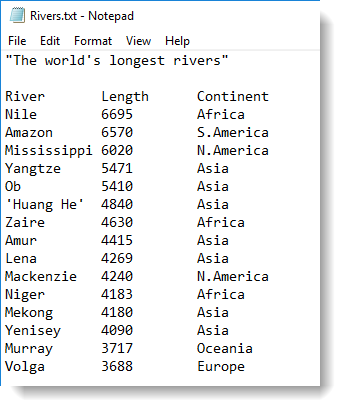
- Data can be numbers or strings. Strings containing spaces or other separators must be enclosed in single quotes (see ‘Huang He’ in the image above) or a backslash character (\) which is the continuation character in the Genstat command language.
- Numerical data will be stored as variates, and strings will be stored in texts. Data can also be grouped automatically, to form factors.
- You can start the file with comments that describe the data, as shown in the image above. Comments must be enclosed by double quotes (“) and the opening quote must be at the very beginning of the line.
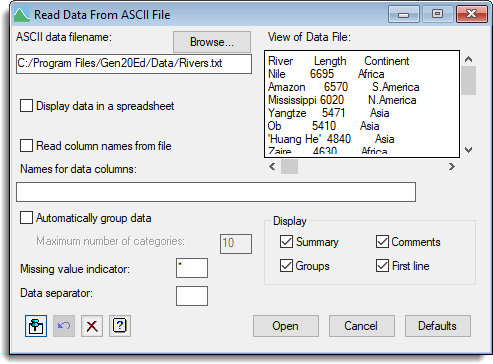
- To import the text file select Data | Load | ASCII file.
- Click Browse to locate your file. A preview of your selected file will display on the right.

- Select Display data in a spreadsheet.
- If the columns are already named select Read column names from file.
OR
To specify the names for each column enter them into the Names for data columns field, separating each name with a space or a comma. - Select other options as required then click OK.

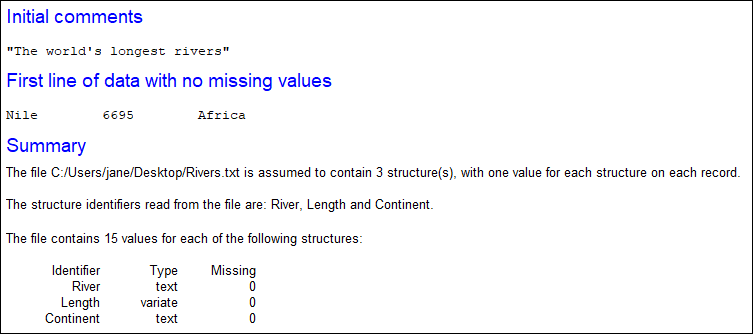
If you imported any comments these will display in the Output window, but not in the spreadsheet.

Import options
| Automatically group data | If selected Genstat will check the number of distinct values in each column and determine if that column should be converted to a factor. Columns that contain fewer distinct values than specified in the Maximum number of categories field will be automatically converted into factors, with numeric levels or text labels created as appropriate. |
| Maximum number of categories | Specifies the maximum number of categories to use when automatically forming factors from the data. For example, if you have a column Gender with values Male, Female and Unspecified you can convert this to a factor by entering a value of 3. |
| Missing value indicator | Specifies the character used to indicate missing data values. Values that begin with this character will be read in as missing. For example, if ‘-‘ is the missing value indicator, any negative numbers will be stored as a missing value. |
| Data separator | Specifies the character used to separate data values in the file, such as a comma. White space (spaces, tabs, etc.) can always be used in addition to the specified data separator. |
| Display | Specifies which information is displayed in the Output window when loading data from the file (see image below). |
