This controls the display and contents of the key or legend provided for the currently active graph.
- Double-click your graph then click the Key tab.
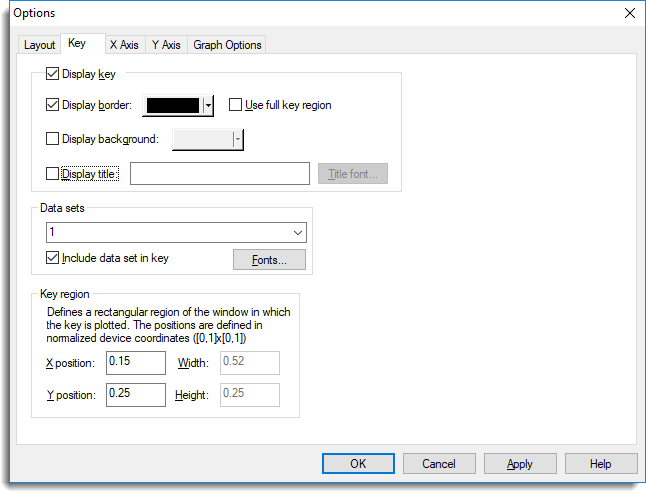
Display key
Controls whether a key is provided for the currently active graph. If selected, this enables other options on the menu so that you can control various aspects of the key.
Display border
Selects whether a border is drawn around the key, using the colour specified. You can size the border to fit around just the text and graphical symbols in the key, with a small margin, or can encompass the full key region (see below).
Display background
Displays the key with the selected background colour. The extent of the background fill is controlled by the Use full key region option.
Display title
Displays a title above the key, using the specified text.
Title font
Sets the font used for the key title.
Data set
Selects the current data set. You can choose between any of the data sets plotted within the currently active graph to control its appearance in the key. To rename the currently selected data set simply edit the text that is displayed.
Include data set in key
Specifies whether to include the currently selected data set in the key.
Fonts
Sets the font used for all data sets in the key.
Key region
Specifies the location and size of the area selected for displaying key information. The values initially used here are derived from the settings of the FRAME command for the key menu.