This provides overall control for the graph layout.
- Double-click your graph then click the Layout tab.
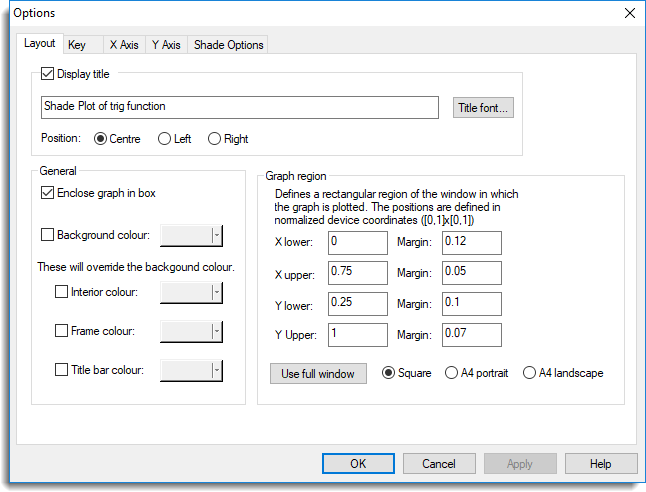
Display title
Enables or disables display of the graph title. The text can be edited and the span modified. The title can be positioned by selecting either the Centre, Left or Right options.
Title font
Sets the font used for the title.
Enclose graph in box
If selected, the graph axes are extended to form a box enclosing the plot.
Background colour
Specifies the background colour for the area of the window in which the graph is plotted. (This is the window defined using FRAME in command mode and specified in the WINDOW option of other graphical commands).
Interior colour
Specifies the colour for the interior of the window (where the data is plotted). This overrides the background colour. Not applicable for 3D plots.
Frame colour
Specifies the colour for the frame of the window (the region outside the interior). This overrides the background colour. Not applicable for 3D plots.
Title bar colour
Specifies the colour for the title bar of the window. This overrides the background colour. Not applicable for 3D plots.
Graph region
Defines the area of the window in which the graph is plotted, along with margins for titles, axis labels, etc. Note that the margins are not applicable for 3D plots.
Use full window
Resets the Graph region bounds to expand the graph to use the maximum area possible, depending on the setting:
| Square | The maximum square area [0-1] x [0-1] that will fit on a page. |
| A4 portrait | The maximum area [0-1] x [0-1.4142] that will fit on an A4 page in portrait orientation . |
| A4 landscape | The maximum area [0-1.4142] x [0-1] that will fit on an A4 page in landscape orientation . |