This sets attributes of the pen used to draw the line for various plots.
- Double-click your graph then click the (graph type) Options tab.
- Click the pen button.
(This will be Contour pen for a contour plot, Grid pen for a surface plot, etc.)
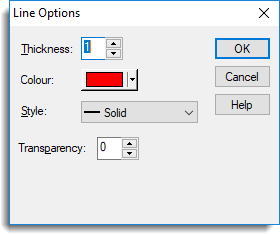
Thickness
Sets the thickness of the line. You can use the up and down arrows to cycle through integer values in the range 1 to 5. Other values, including fractional values, can be typed in directly.
Colour
Displays or modifies the current colour setting for the line.
Style
Sets the line style. You can choose between Solid, Dot, Dash, Dot dash, Tight dash, Long dash, Short dash, Close dot, Fine dot and Double dot dash.
Transparency
Sets the transparency for the line. You can use the up and down arrows to cycle through integer values in the range 0 (opaque) to 255 (completely transparent).