Use this to customize the graphical displays of marker scores for a set of genotypes. This dialog opens when you click the Colours button on the Genotype Data Plots dialog.
Type of population
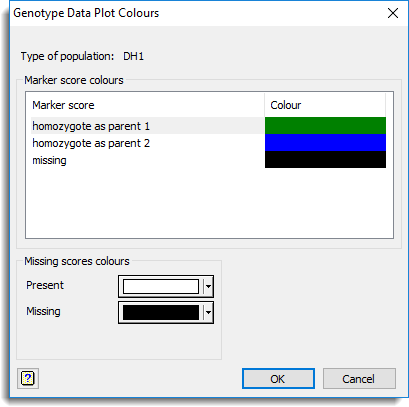
This displays the population type that the colours are to be set for.
Marker scores colours
This displays the appropriate marker genotype scores and associated colours for the selected population. For a DH1, BC1, F2, BCxSy or RIL population each genotype code marker score colour can be changed by clicking on the colour button and choosing from the dropdown list. For an association mapping population you can change the colours by double-clicking on the colours within the available list.
See also
- Genotype data plots menu
- QTL data space for using data in QTL menus
- QTL analysis using menus
- DQMKSCORES procedure in command mode